Proses Penelitian
150 gambar dari penelitian yang ditinjau oleh rekan sejawat
Oral low-dose minoxidil has emerged as an alternative to topical formulations for hair loss treatment, with studies suggesting systemic administration may benefit patients who experience scalp irritation from topical application. Cardiovascular monitoring is indicated for oral use.
Minoxidil and its use in hair disorders: a review.
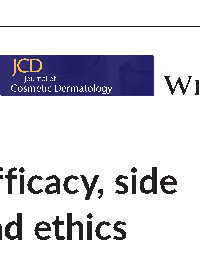
Treatment options for androgenetic alopecia range from FDA-approved pharmacological agents (minoxidil and finasteride) to emerging therapies including low-level laser therapy, platelet-rich plasma, and hair transplantation. Efficacy, side effect profiles, and patient compliance vary substantially across modalities.
Treatment options for androgenetic alopecia: Efficacy, side effects, compliance, financial considerations, and …
A multicenter, randomized, sham-controlled trial demonstrates the efficacy of a low-level laser device for treating male and female pattern hair loss. Hair count increases in the active treatment group significantly exceed those in the sham control group.
Efficacy and safety of a low-level laser device in the treatment of …
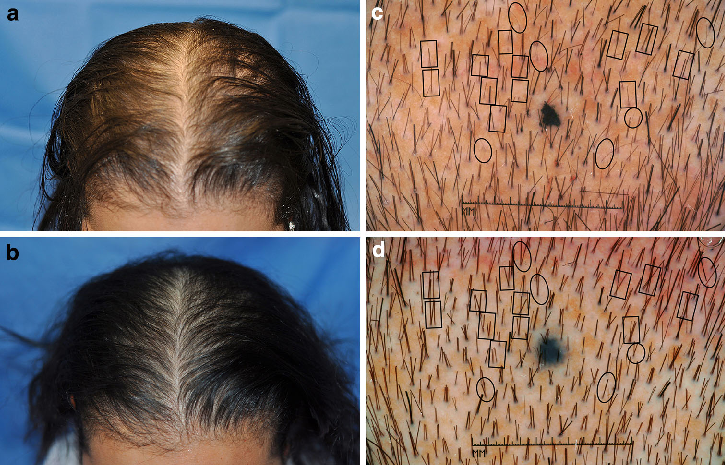
Single gavage with CBD at 246, 738, or 2460 mg/kg produced dose-dependent hepatotoxic effects in mice. Body weight changes, liver-to-body weight ratios, and intrahepatic total glutathione concentrations at 24 hours indicate significant liver burden at the highest doses.
Hepatotoxicity of a Cannabidiol-Rich Cannabis Extract in the Mouse Model.
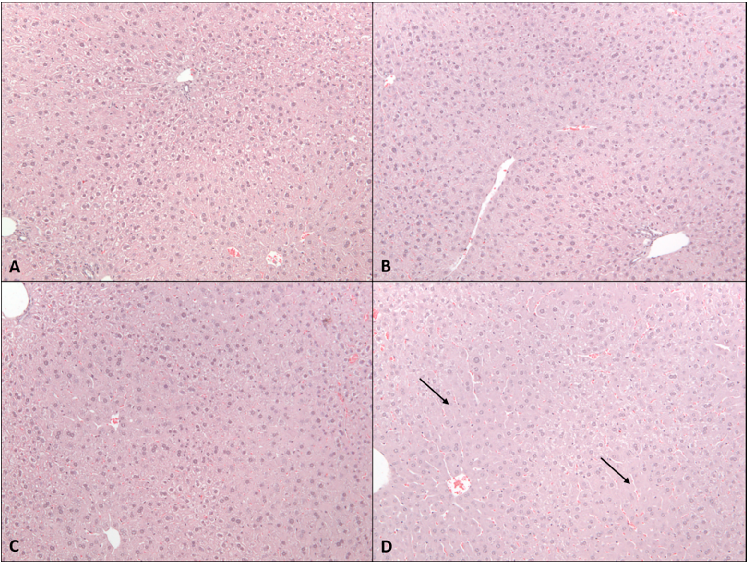
Sub-acute CBD administration (10 daily doses at 61.5-615 mg/kg) produced cumulative hepatic effects. This figure presents body weight curves and liver enzyme data from the two-week dosing protocol.
Hepatotoxicity of a Cannabidiol-Rich Cannabis Extract in the Mouse Model.
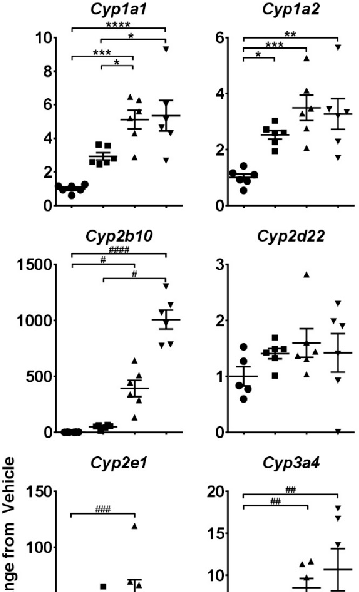
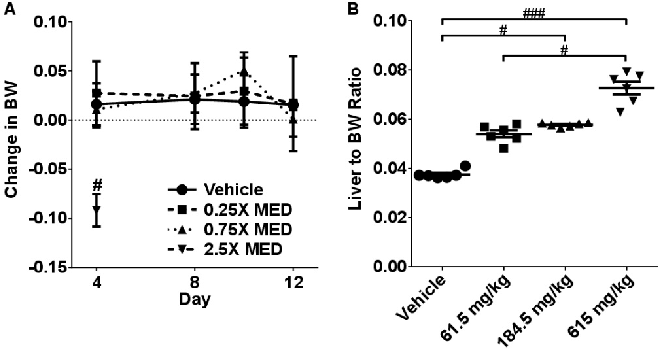
Single CBD gavage induced significant changes in hepatic cytochrome P450 and UDP-glucuronosyltransferase expression. Quantitative real-time PCR data demonstrate dose-dependent upregulation of these xenobiotic-metabolizing enzymes at 24 hours post-treatment.
Hepatotoxicity of a Cannabidiol-Rich Cannabis Extract in the Mouse Model.
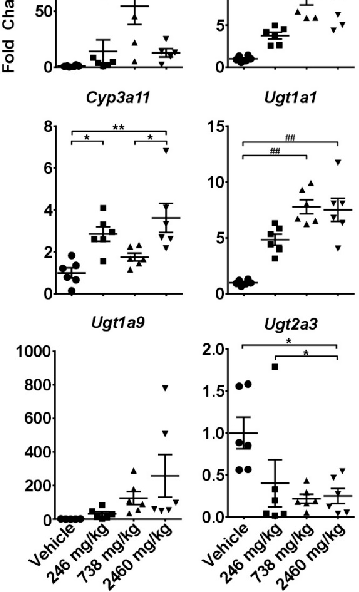
Hematoxylin and eosin-stained liver sections reveal dose-dependent histomorphological changes after 2-week CBD administration. Mice receiving 615 mg/kg CBD exhibited notable hepatocellular alterations compared to vehicle controls and lower-dose groups.
Hepatotoxicity of a Cannabidiol-Rich Cannabis Extract in the Mouse Model.
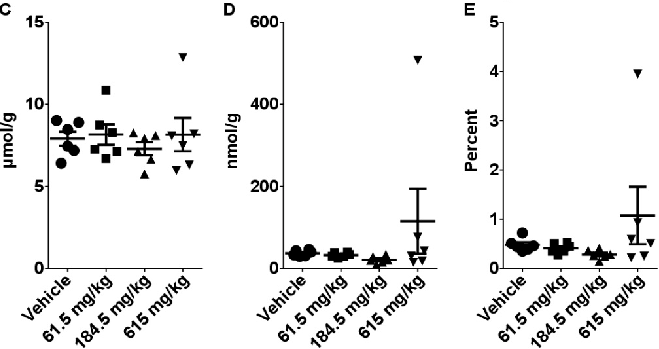
Sub-acute CBD dosing produced changes in liver weight and serum biochemistry parameters. This figure compiles multi-parameter hepatotoxicity data from the 10-day dosing study.
Hepatotoxicity of a Cannabidiol-Rich Cannabis Extract in the Mouse Model.
Hepatic gene expression profiling after sub-acute CBD treatment reveals broader metabolic impacts. This figure presents transcriptomic data on stress-response and metabolism-related genes in the liver.
Hepatotoxicity of a Cannabidiol-Rich Cannabis Extract in the Mouse Model.
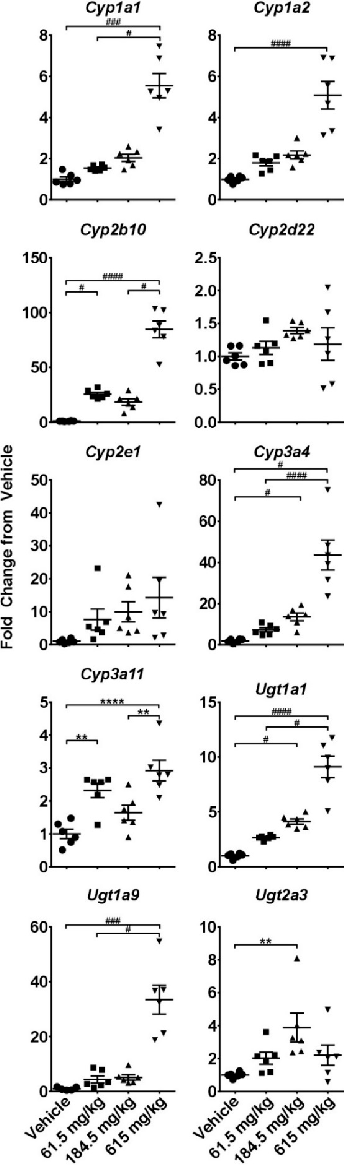
Two-week CBD administration produced sustained changes in cytochrome P450 and UDP-glucuronosyltransferase gene expression. Quantitative PCR data collected 6 hours after the last gavage indicate persistent hepatic enzyme induction at higher CBD doses.
Hepatotoxicity of a Cannabidiol-Rich Cannabis Extract in the Mouse Model.
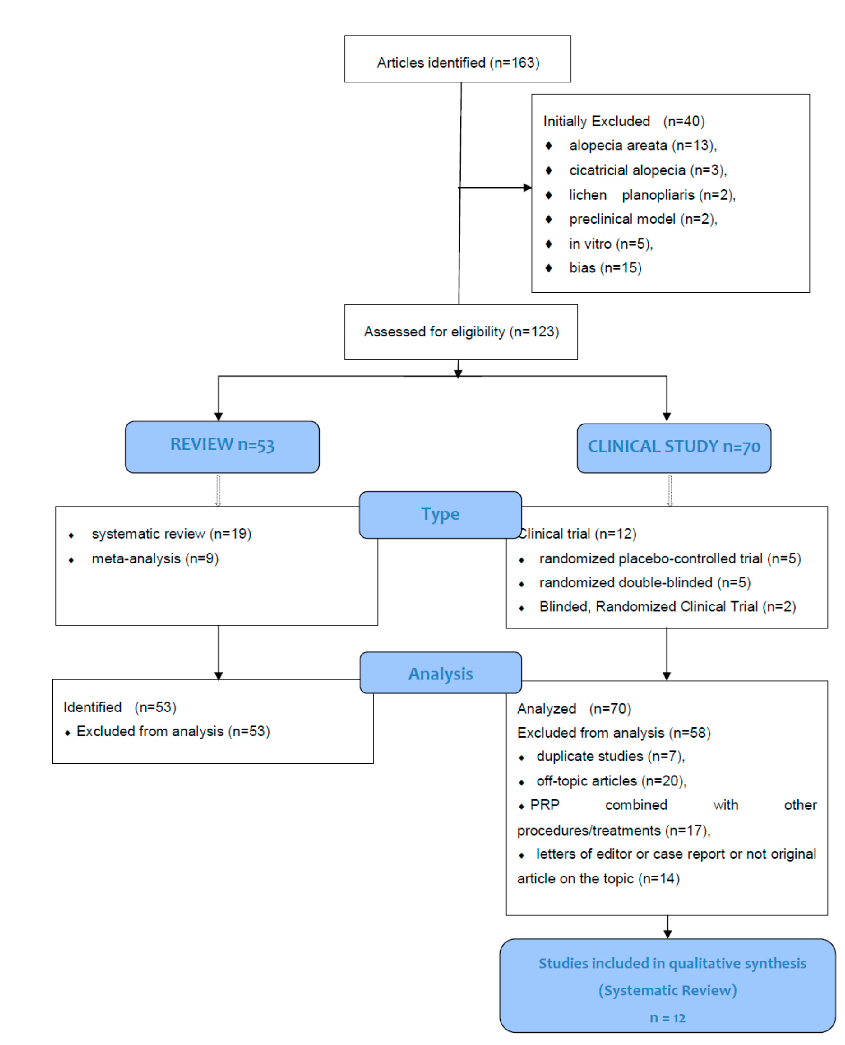
The CONSORT (Consolidated Standards of Reporting Trials) flow diagram documents the systematic review process from identification through screening, eligibility assessment, and final inclusion of studies evaluating PRP for androgenetic alopecia.
Systematic Review of Platelet-Rich Plasma Use in Androgenetic Alopecia Compared with Minoxidil®, …
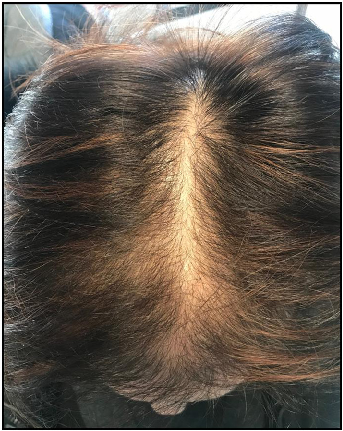
A clinical photograph demonstrating female pattern hair loss, showing characteristic diffuse thinning across the crown and mid-scalp. FPHL affects women with varying degrees of severity and may lead to significant psychological distress.
Female pattern hair loss: A clinical, pathophysiologic, and therapeutic review.
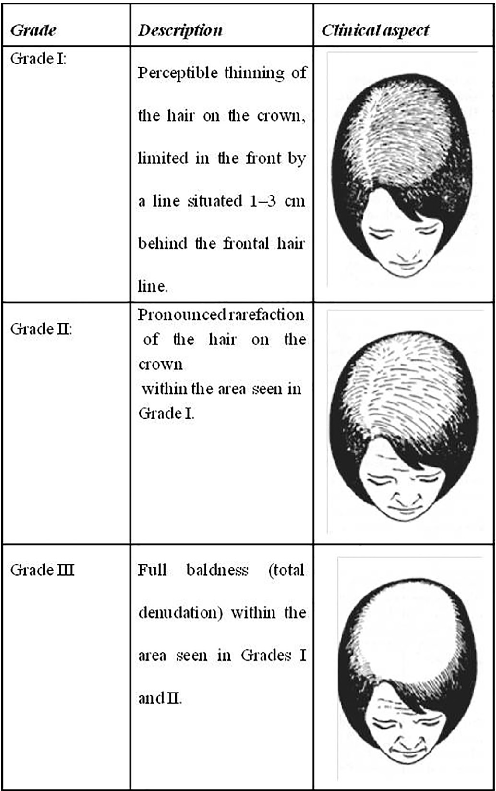
The Ludwig scale classifies female pattern hair loss into three progressive stages, ranging from minimal thinning at the crown (Grade I) to extensive hair loss across the top of the scalp (Grade III). This grading system remains one of the most widely used clinical tools for assessing FPHL severity.
Female pattern hair loss: A clinical, pathophysiologic, and therapeutic review.
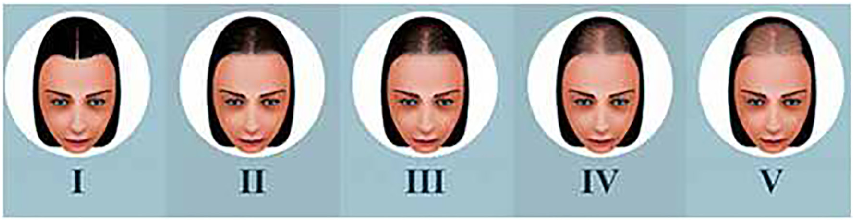
Sinclair's classification divides midline pattern alopecia into four intensity levels, progressing from a normal-appearing scalp to increasingly visible widening of the central part. The scale, introduced by Sinclair et al. (2005), provides a practical visual reference for clinicians assessing hair loss severity.
Female pattern hair loss: A clinical, pathophysiologic, and therapeutic review.
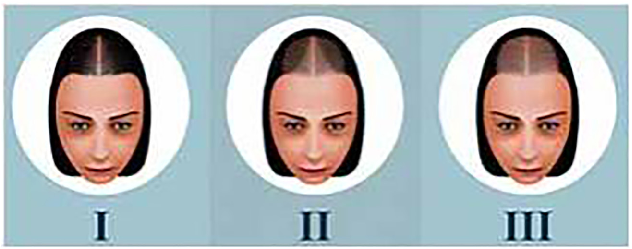
Olsen's classification system highlights the characteristic triangular or Christmas-tree pattern of frontovertical alopecia seen in female pattern hair loss. The accentuation of thinning at the frontal midline distinguishes this pattern from the more diffuse Ludwig classification.
Female pattern hair loss: A clinical, pathophysiologic, and therapeutic review.
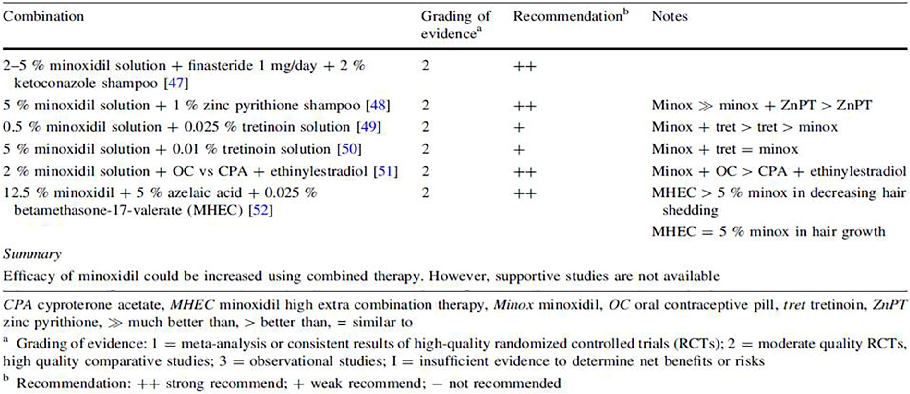
A summary of clinical evidence supporting combination therapy with topical minoxidil for androgenetic alopecia in both men and women. The data, compiled by Varothai and Bergfeld (2014), indicates that multi-modal treatment approaches may offer improved outcomes compared to monotherapy.
Female pattern hair loss: A clinical, pathophysiologic, and therapeutic review.
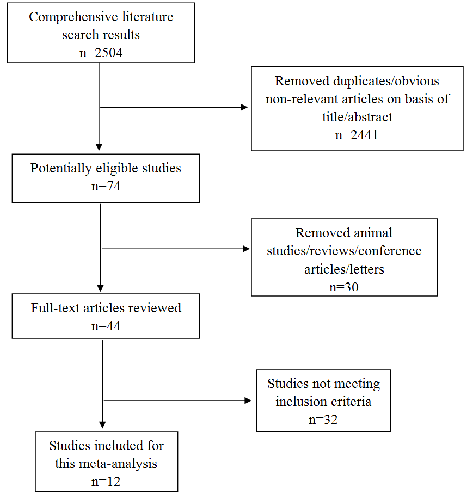
PRISMA flow diagram showing the literature search strategy, screening process, and final study selection for a meta-analysis of folate and vitamin B12 levels in inflammatory bowel disease.
Associations between Folate and Vitamin B12 Levels and Inflammatory Bowel Disease: A …
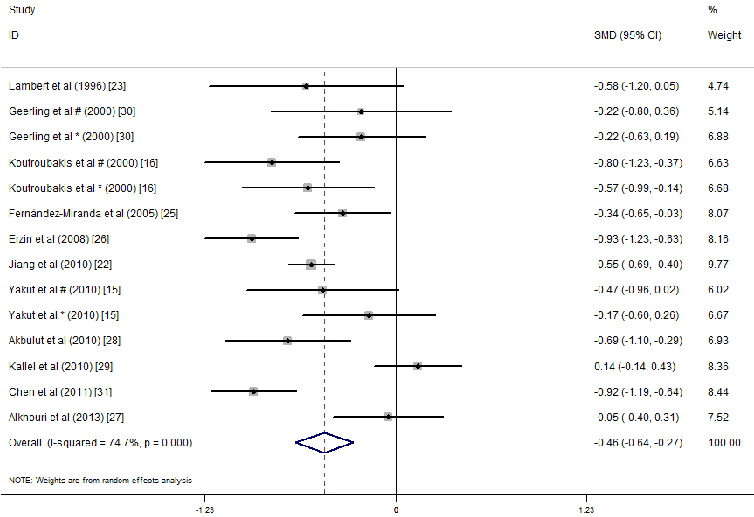
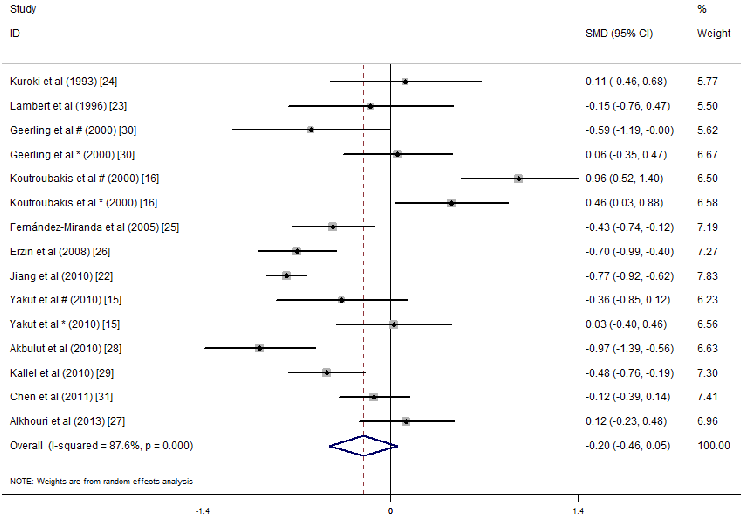
Forest plot displaying pooled effect sizes or summary statistics from one of the meta-analytic comparisons of micronutrient concentrations between IBD patients and healthy individuals.
Associations between Folate and Vitamin B12 Levels and Inflammatory Bowel Disease: A …
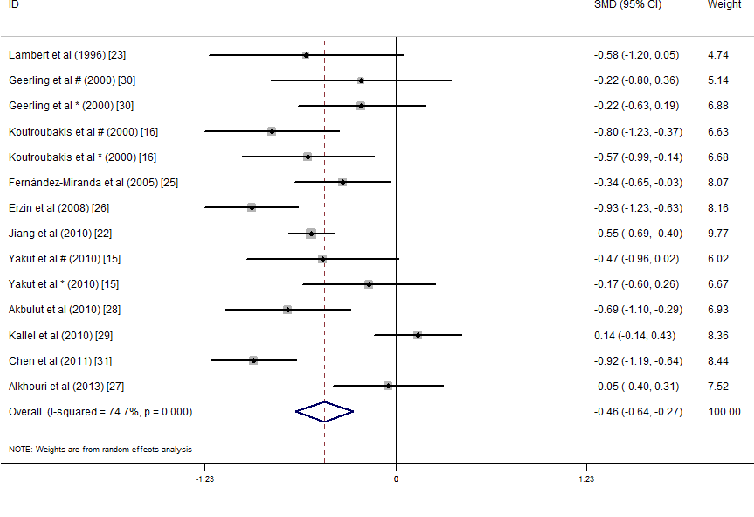
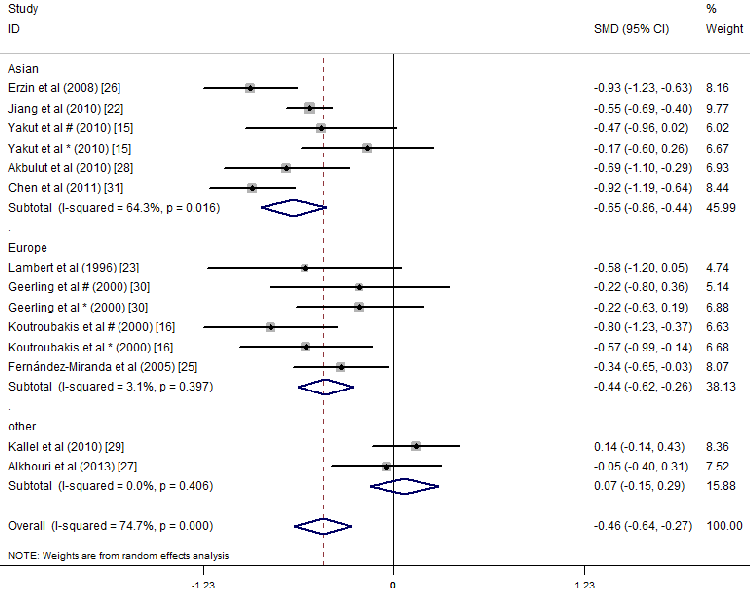
Subgroup or sensitivity analysis from the IBD meta-analysis, examining whether disease type, geographic location, or study design influences the observed associations with folate or B12 status.
Associations between Folate and Vitamin B12 Levels and Inflammatory Bowel Disease: A …
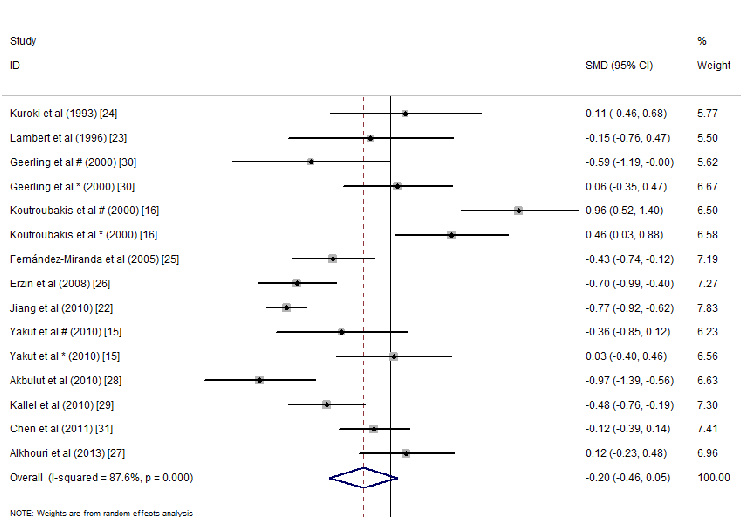
Forest plot comparing serum folate concentrations between IBD patients and controls, with standardized mean differences, 95% confidence intervals, and study weights displayed for each included investigation.
Associations between Folate and Vitamin B12 Levels and Inflammatory Bowel Disease: A …
Funnel plot or additional sensitivity analysis evaluating publication bias in the meta-analysis of folate and vitamin B12 levels in inflammatory bowel disease.
Associations between Folate and Vitamin B12 Levels and Inflammatory Bowel Disease: A …
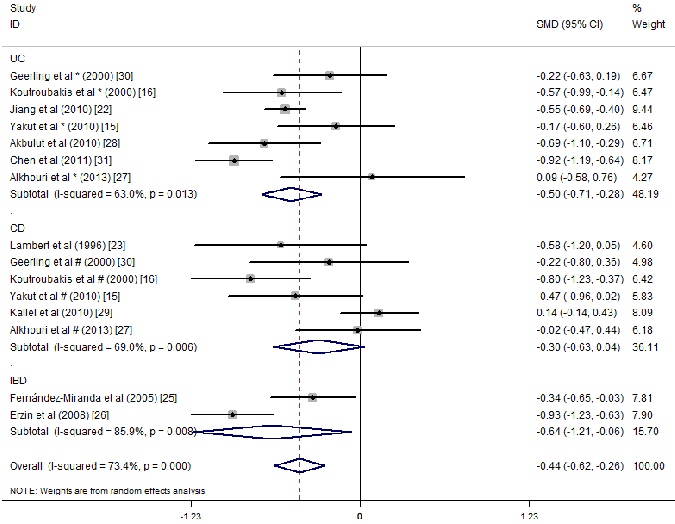
Subgroup analysis stratifying the folate or B12 meta-analysis results by Crohn's disease versus ulcerative colitis, revealing potential differences in micronutrient depletion between IBD subtypes.
Associations between Folate and Vitamin B12 Levels and Inflammatory Bowel Disease: A …
Leave-one-out sensitivity analysis or cumulative meta-analysis assessing the robustness of the pooled effect estimate for micronutrient status differences in IBD.
Associations between Folate and Vitamin B12 Levels and Inflammatory Bowel Disease: A …
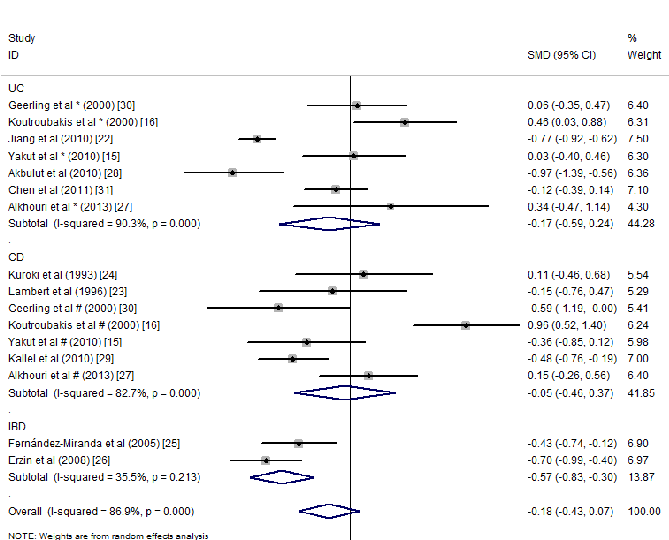
Forest plot of serum folate concentrations in IBD patients versus controls, presenting standardized mean differences with 95% confidence intervals. Subtotals are stratified by IBD subtype to examine disease-specific patterns.
Associations between Folate and Vitamin B12 Levels and Inflammatory Bowel Disease: A …
Halaman 1 dari 7