Proses Penelitian
40 gambar dari penelitian yang ditinjau oleh rekan sejawat
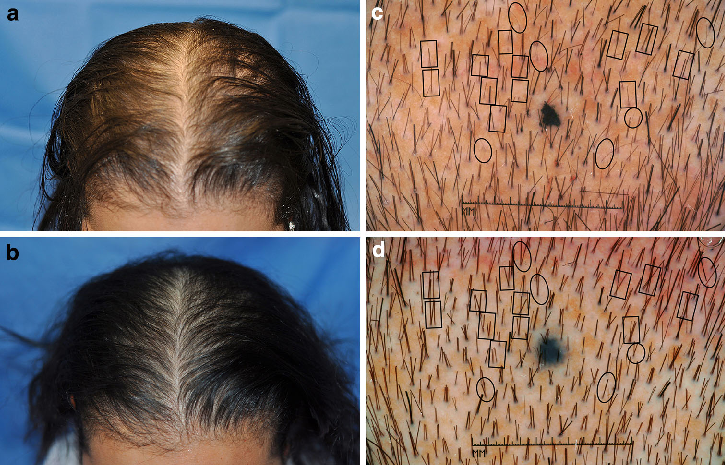
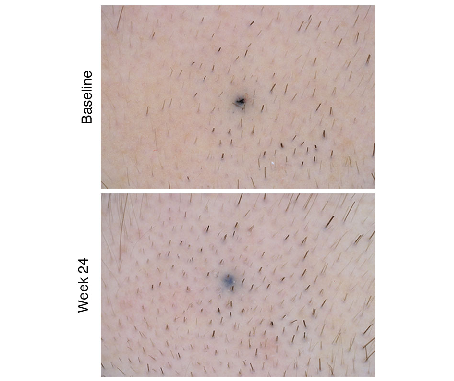
A multicenter, randomized, sham-controlled trial demonstrates the efficacy of a low-level laser device for treating male and female pattern hair loss. Hair count increases in the active treatment group significantly exceed those in the sham control group.
Efficacy and safety of a low-level laser device in the treatment of …
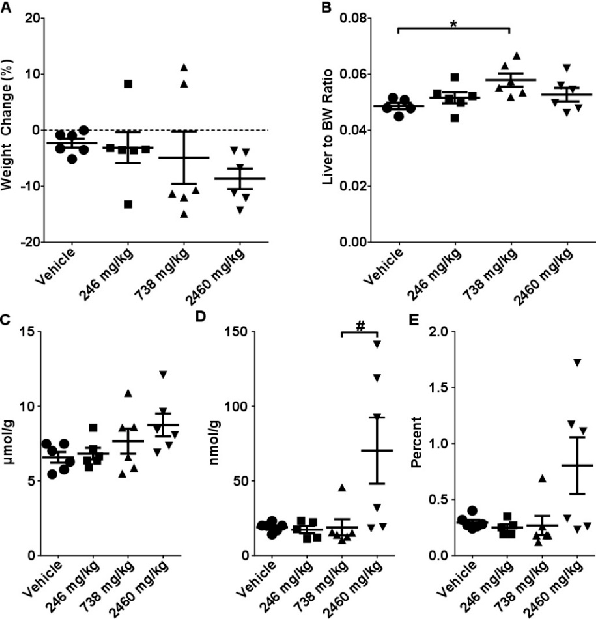
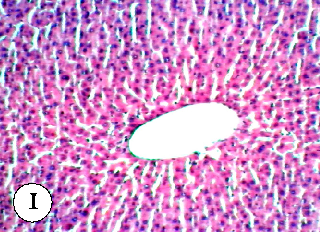
Single gavage with CBD at 246, 738, or 2460 mg/kg produced dose-dependent hepatotoxic effects in mice. Body weight changes, liver-to-body weight ratios, and intrahepatic total glutathione concentrations at 24 hours indicate significant liver burden at the highest doses.
Hepatotoxicity of a Cannabidiol-Rich Cannabis Extract in the Mouse Model.
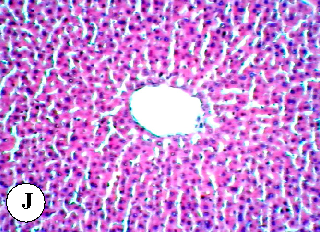
Sub-acute CBD administration (10 daily doses at 61.5-615 mg/kg) produced cumulative hepatic effects. This figure presents body weight curves and liver enzyme data from the two-week dosing protocol.
Hepatotoxicity of a Cannabidiol-Rich Cannabis Extract in the Mouse Model.
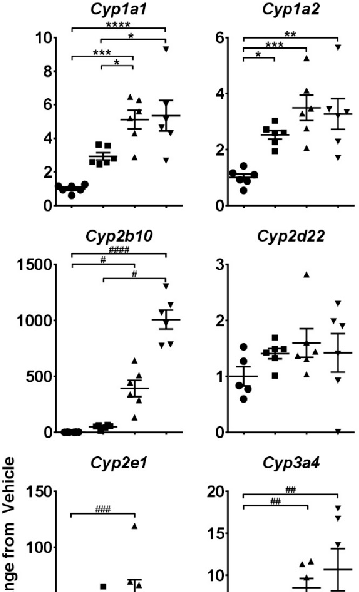
Single CBD gavage induced significant changes in hepatic cytochrome P450 and UDP-glucuronosyltransferase expression. Quantitative real-time PCR data demonstrate dose-dependent upregulation of these xenobiotic-metabolizing enzymes at 24 hours post-treatment.
Hepatotoxicity of a Cannabidiol-Rich Cannabis Extract in the Mouse Model.
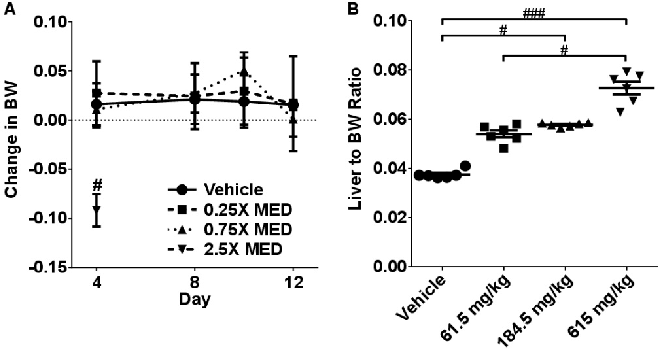
Sub-acute CBD dosing produced changes in liver weight and serum biochemistry parameters. This figure compiles multi-parameter hepatotoxicity data from the 10-day dosing study.
Hepatotoxicity of a Cannabidiol-Rich Cannabis Extract in the Mouse Model.
Hepatic gene expression profiling after sub-acute CBD treatment reveals broader metabolic impacts. This figure presents transcriptomic data on stress-response and metabolism-related genes in the liver.
Hepatotoxicity of a Cannabidiol-Rich Cannabis Extract in the Mouse Model.
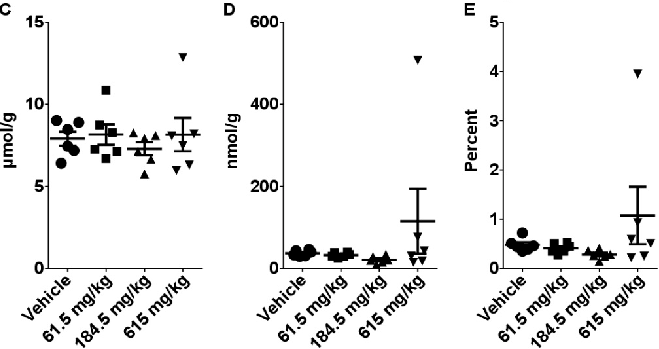
Two-week CBD administration produced sustained changes in cytochrome P450 and UDP-glucuronosyltransferase gene expression. Quantitative PCR data collected 6 hours after the last gavage indicate persistent hepatic enzyme induction at higher CBD doses.
Hepatotoxicity of a Cannabidiol-Rich Cannabis Extract in the Mouse Model.
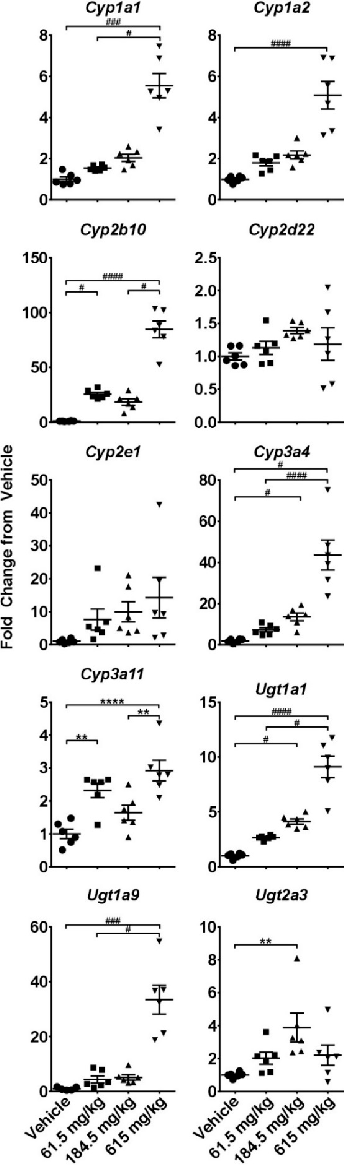
Publication trends for L-cysteine research from 1950 through 2017 reveal a steep increase in scientific output, particularly after 2000. The PubMed-based analysis demonstrates growing interest in cysteine's roles in health and disease over nearly seven decades.
Effects of the Usage of l-Cysteine (l-Cys) on Human Health.
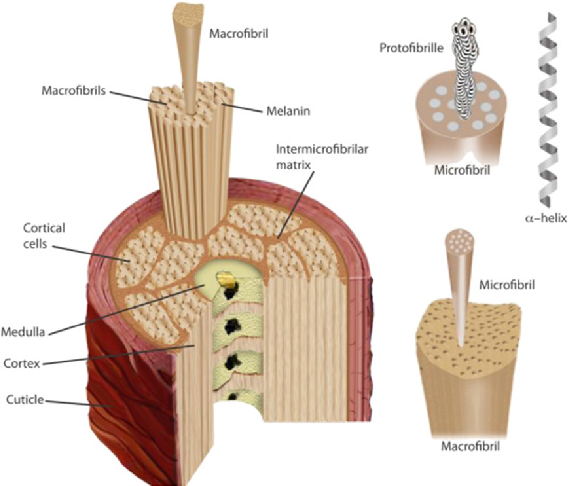
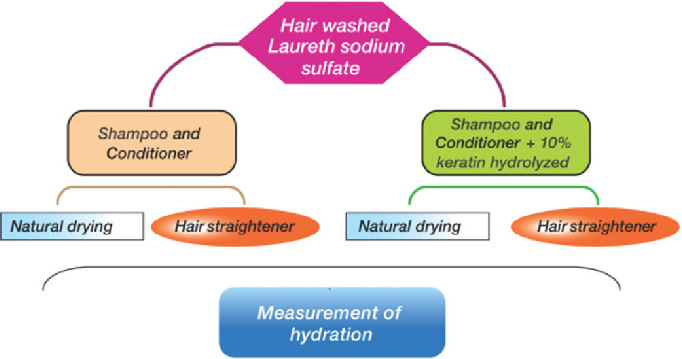
Enzymatic hydrolysis of feather keratin by microbial keratinases is characterized, showing protein fragment profiles. The Bacillus subtilis-derived keratinase produces low molecular weight hydrolysates suitable for hair care applications.
Feather keratin hydrolysates obtained from microbial keratinases: effect on hair fiber.
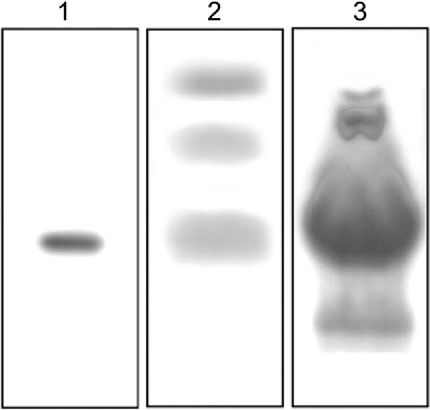
Molecular weight distribution of the keratin hydrolysates is analyzed, comparing enzymatic products with commercial alternatives. Lower molecular weight peptides penetrate hair fibers more effectively, offering superior protection against chemical and environmental damage.
Feather keratin hydrolysates obtained from microbial keratinases: effect on hair fiber.
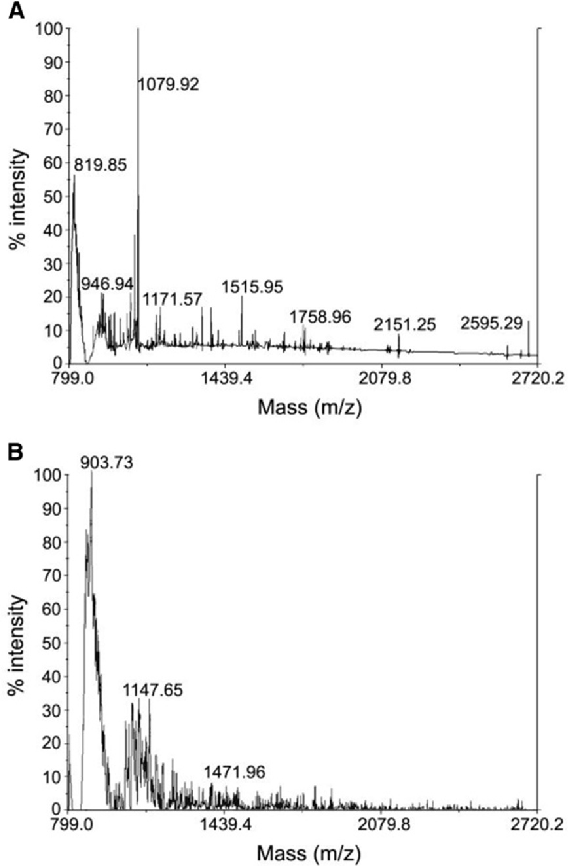
MALDI-TOF mass spectrometry analysis compares enzymatic keratin hydrolysates from Bacillus subtilis with a commercial hydrolysate (KH1). The mass spectra reveal distinct peptide profiles, with the enzymatic product showing a different molecular weight distribution pattern.
Feather keratin hydrolysates obtained from microbial keratinases: effect on hair fiber.
Tensile strength or mechanical properties of hair fibers treated with the enzymatic keratin hydrolysates are measured. The protective effect of low molecular weight protein fragments on hair integrity is quantified against untreated controls.
Feather keratin hydrolysates obtained from microbial keratinases: effect on hair fiber.
Results from a phase III randomized controlled trial compare the efficacy of topical finasteride spray versus placebo in men with androgenetic alopecia. The data indicate changes in hair count or density over the treatment period, with topical finasteride associated with reduced systemic exposure relative to the oral formulation.
Efficacy and safety of topical finasteride spray solution for male androgenetic alopecia: …
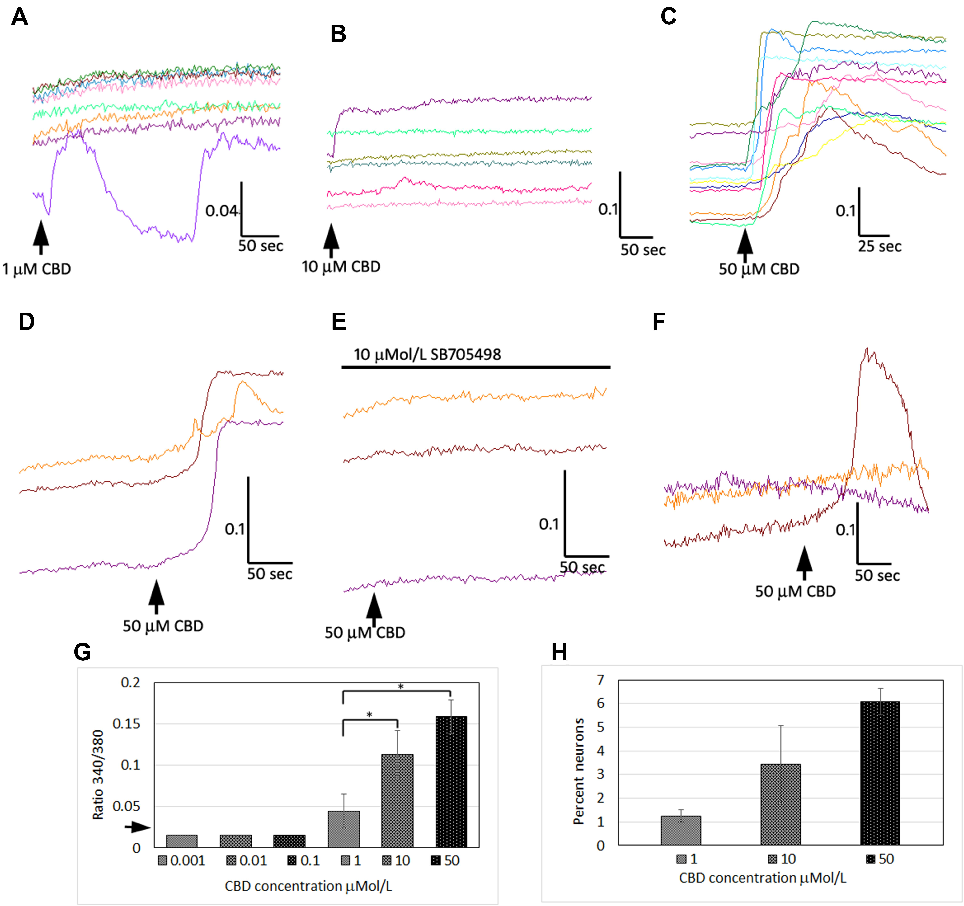
Calcium imaging or electrophysiological recordings from cultured DRG neurons demonstrating CBD's dose-dependent effects on TRPV1-mediated capsaicin responses and downstream signaling pathways.
CBD Effects on TRPV1 Signaling Pathways in Cultured DRG Neurons.
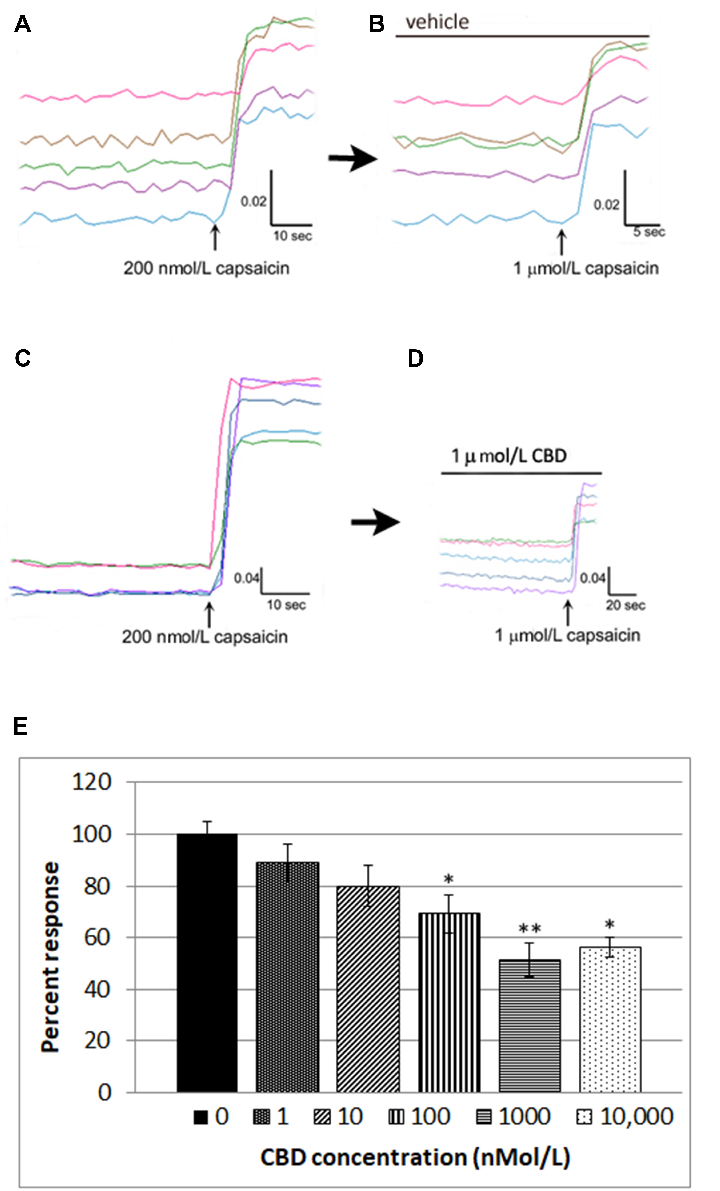
Calcium imaging or electrophysiological recordings from cultured DRG neurons demonstrating CBD's dose-dependent effects on TRPV1-mediated capsaicin responses and downstream signaling pathways.
CBD Effects on TRPV1 Signaling Pathways in Cultured DRG Neurons.
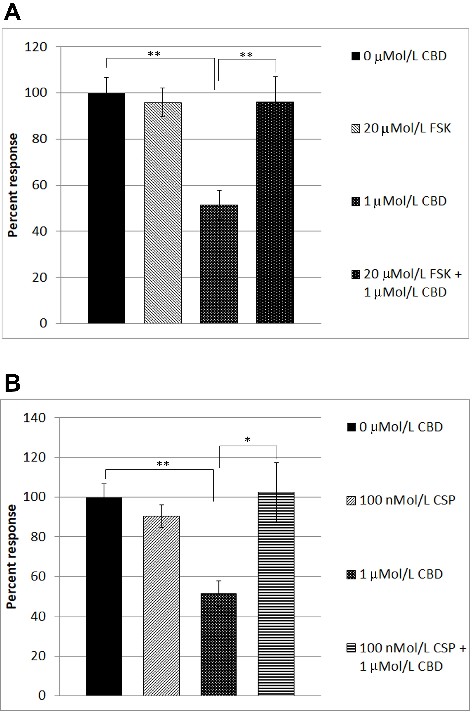
CBD-mediated TRPV1 desensitization was reversed by forskolin (cAMP pathway activator) and cyclosporin (calcineurin inhibitor), indicating that cannabidiol's analgesic mechanism involves phosphatase-dependent receptor desensitization in DRG neurons.
CBD Effects on TRPV1 Signaling Pathways in Cultured DRG Neurons.
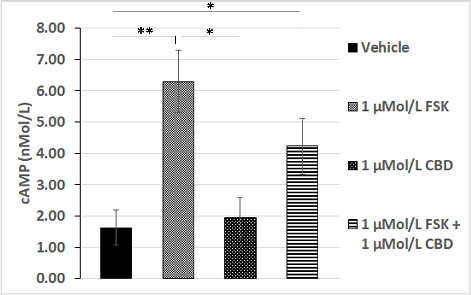
Forskolin-stimulated cAMP levels were significantly inhibited by CBD co-treatment in DRG neurons, suggesting cannabidiol modulates the cAMP-PKA signaling axis downstream of TRPV1 activation.
CBD Effects on TRPV1 Signaling Pathways in Cultured DRG Neurons.
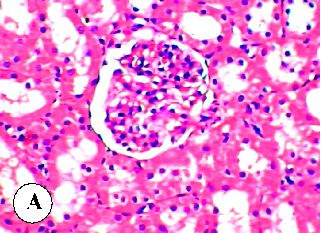
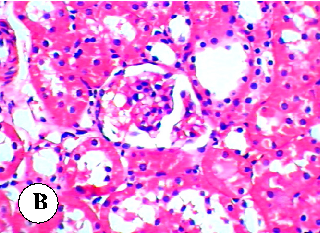
Antioxidant enzyme activity measurements (SOD, catalase, or GPx) in liver or kidney tissue across all experimental groups in the diazinon-plant oil study.
Protective effect of some plant oils on diazinon induced hepatorenal toxicity in …
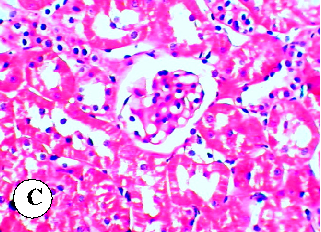
Lipid peroxidation or oxidative damage marker levels in renal tissue of rats treated with diazinon and plant oils.
Protective effect of some plant oils on diazinon induced hepatorenal toxicity in …
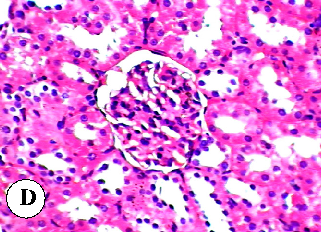
Body weight changes or organ weight ratios in rats across the different diazinon and plant oil treatment groups over the study period.
Protective effect of some plant oils on diazinon induced hepatorenal toxicity in …
Hematological parameters in diazinon-exposed rats with and without plant oil supplementation, reflecting systemic toxicity effects.
Protective effect of some plant oils on diazinon induced hepatorenal toxicity in …
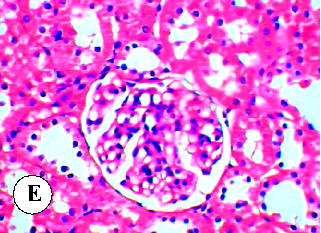
Cholinesterase activity levels in rats treated with diazinon and plant oils, as diazinon is an organophosphate that inhibits acetylcholinesterase.
Protective effect of some plant oils on diazinon induced hepatorenal toxicity in …
Additional biochemical markers in the diazinon-plant oil study, potentially including lipid profile or protein levels across experimental groups.
Protective effect of some plant oils on diazinon induced hepatorenal toxicity in …
Inflammatory marker levels or immunological parameters measured in rats exposed to diazinon with and without plant oil protection.
Protective effect of some plant oils on diazinon induced hepatorenal toxicity in …
Halaman 1 dari 2