Research Figures
150 figures from peer-reviewed research
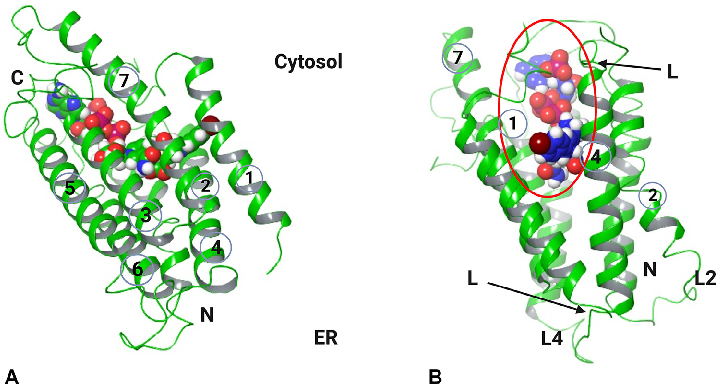
The three-dimensional structure of human SRD5A2 is shown with its seven transmembrane domains, active site, and NADP-DHF adduct positioning within the enzyme channel.
Androgenetic alopecia: An update.
Experimental findings on adverse effects of 5-alpha-reductase inhibitors in animal models are summarized, providing mechanistic insights into how these drugs may affect the central and peripheral nervous systems.
Post-finasteride syndrome: An emerging clinical problem.
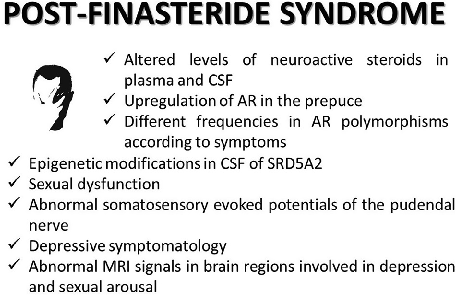
Proposed pathophysiological mechanisms underlying the persistent side effects of finasteride are outlined, connecting hormonal disruption to epigenetic changes and altered gut microbiota composition.
Post-finasteride syndrome: An emerging clinical problem.
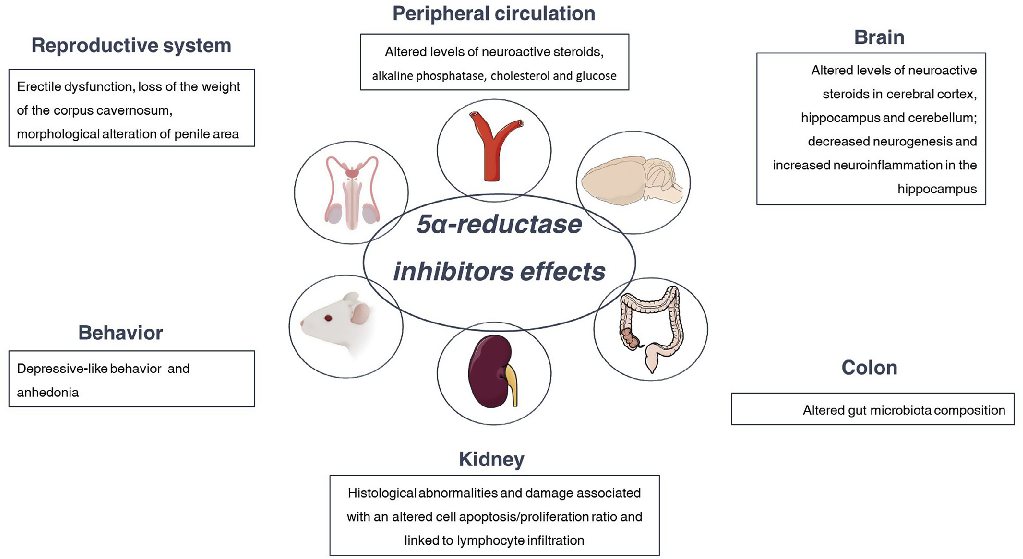
Side effects of treatment with 5-alpha-reductase inhibitors observed in experimental models are comprehensively catalogued, covering reproductive, neurological, and metabolic endpoints.
Post-finasteride syndrome: An emerging clinical problem.
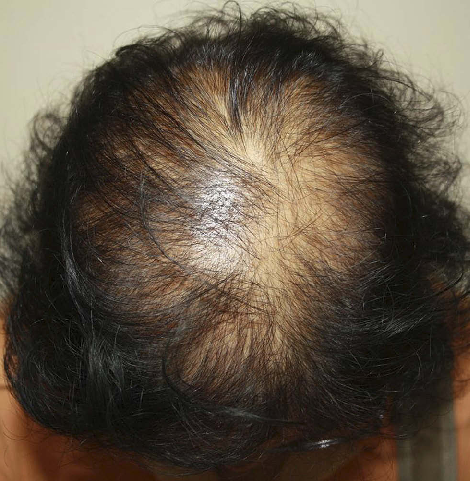
A proposed treatment algorithm for female pattern hair loss incorporates finasteride as a potential alternative when topical minoxidil fails, including appropriate patient selection criteria and monitoring requirements.
Finasteride and Its Potential for the Treatment of Female Pattern Hair Loss: …

Forest plot from the meta-analysis comparing dutasteride versus finasteride for hair count improvement in men with androgenetic alopecia over a 24-week treatment period.
The efficacy and safety of dutasteride compared with finasteride in treating men …
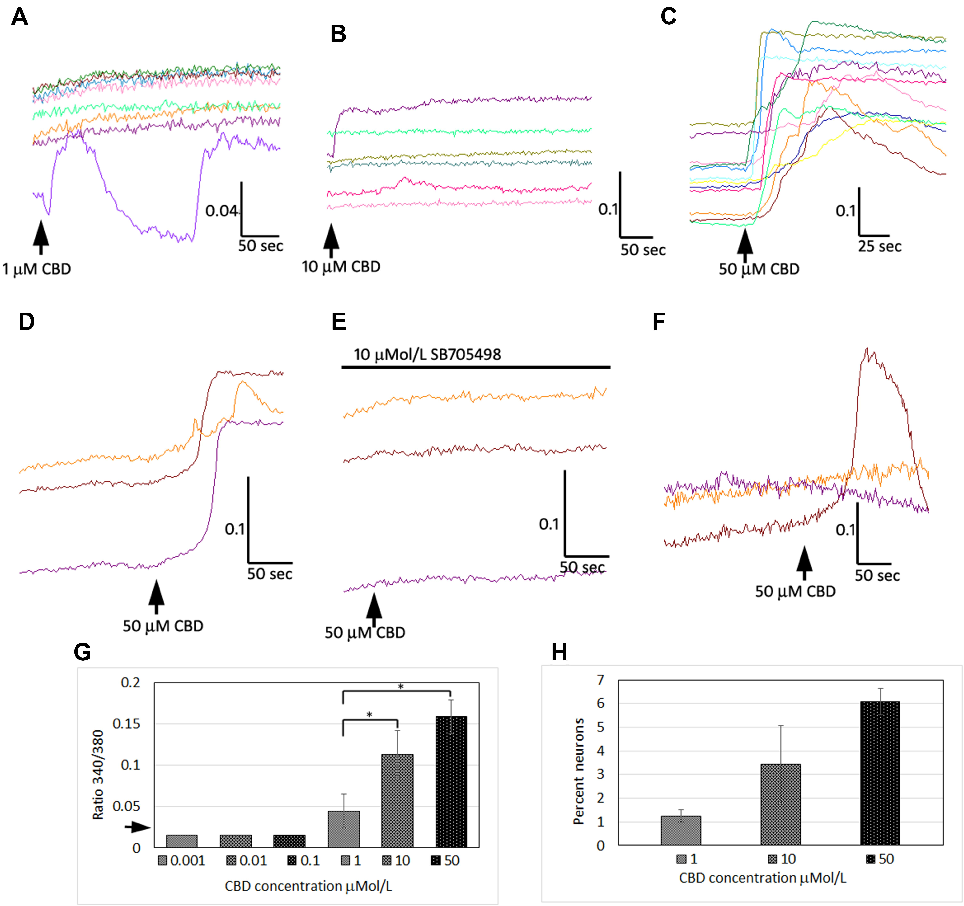
Calcium imaging or electrophysiological recordings from cultured DRG neurons demonstrating CBD's dose-dependent effects on TRPV1-mediated capsaicin responses and downstream signaling pathways.
CBD Effects on TRPV1 Signaling Pathways in Cultured DRG Neurons.
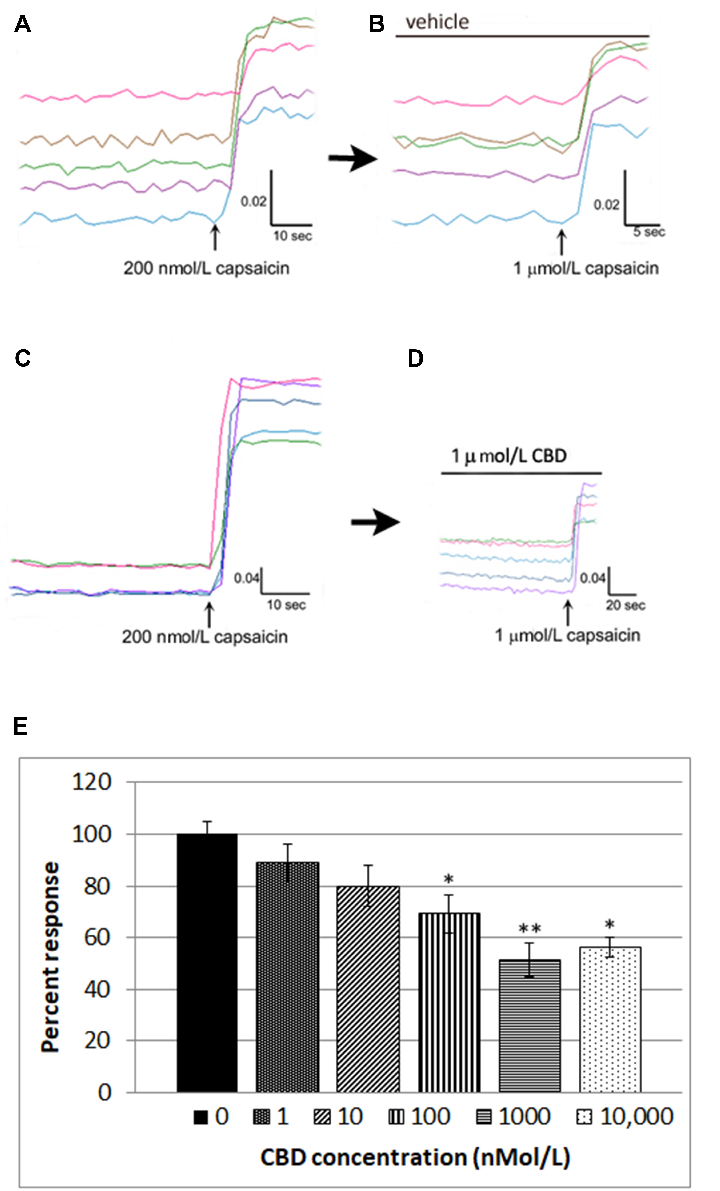
Calcium imaging or electrophysiological recordings from cultured DRG neurons demonstrating CBD's dose-dependent effects on TRPV1-mediated capsaicin responses and downstream signaling pathways.
CBD Effects on TRPV1 Signaling Pathways in Cultured DRG Neurons.
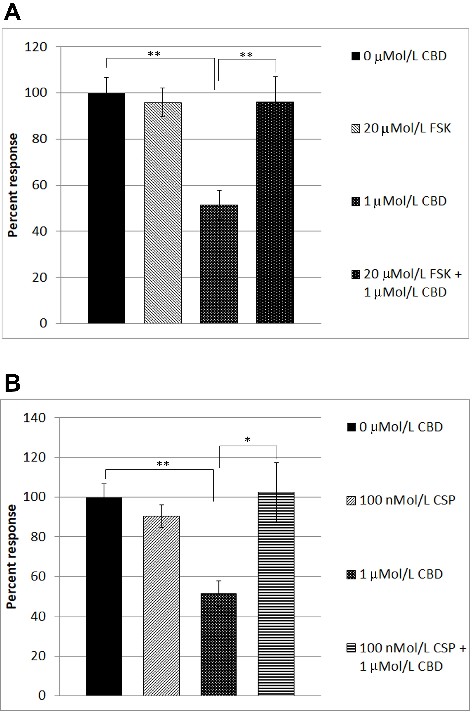
CBD-mediated TRPV1 desensitization was reversed by forskolin (cAMP pathway activator) and cyclosporin (calcineurin inhibitor), indicating that cannabidiol's analgesic mechanism involves phosphatase-dependent receptor desensitization in DRG neurons.
CBD Effects on TRPV1 Signaling Pathways in Cultured DRG Neurons.
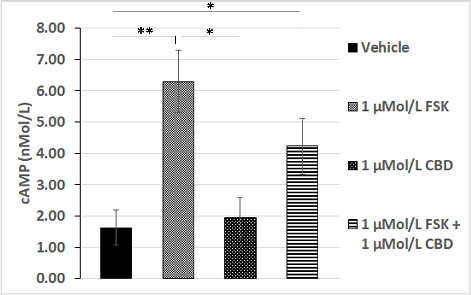
Forskolin-stimulated cAMP levels were significantly inhibited by CBD co-treatment in DRG neurons, suggesting cannabidiol modulates the cAMP-PKA signaling axis downstream of TRPV1 activation.
CBD Effects on TRPV1 Signaling Pathways in Cultured DRG Neurons.
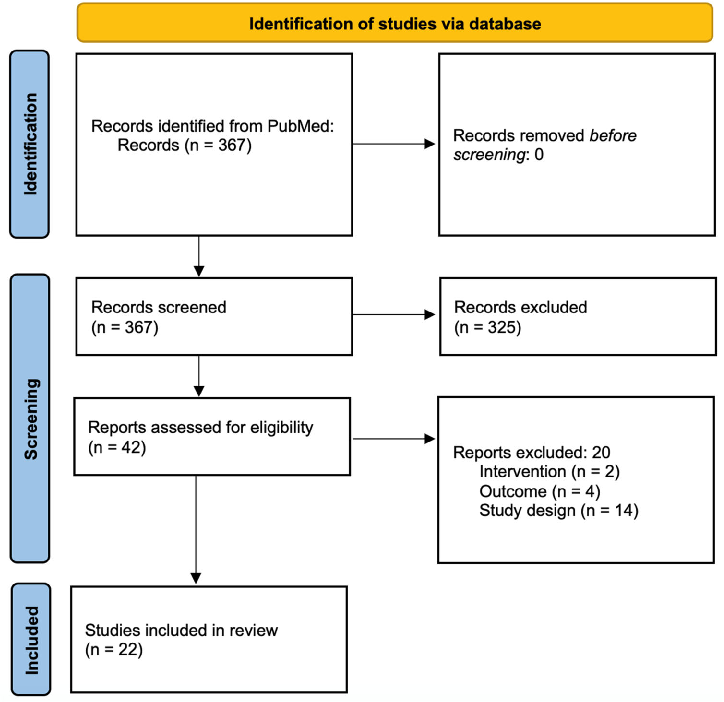
PRISMA flowchart detailing the systematic literature search and screening process for studies on microneedling in hair loss disorders. The diagram tracks records from initial identification through screening, eligibility assessment, and final inclusion.
Microneedling and Its Use in Hair Loss Disorders: A Systematic Review.
![Figure 1. CBD chemical structure (source: PUBCHEM [9]). CBD: cannabidiol.](https://pdfs.citedhealth.com/figures/32655732/113.png)
Chemical structure of cannabidiol (CBD), the non-psychoactive cannabinoid derived from Cannabis sativa, illustrating its molecular formula and structural features.
The Impact of Cannabidiol on Psychiatric and Medical Conditions.
![Figure 2. Chemical structure of THC for comparison (source: PUBCHEM [9]). THC: tetrahydrocannabinol.](https://pdfs.citedhealth.com/figures/32655732/115.png)
Chemical structure of tetrahydrocannabinol (THC) presented for comparison with CBD, highlighting the structural differences between the psychoactive and non-psychoactive cannabinoids.
The Impact of Cannabidiol on Psychiatric and Medical Conditions.
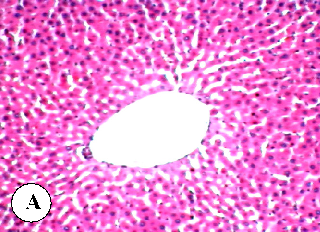
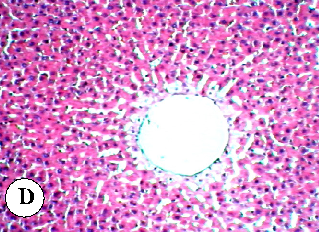
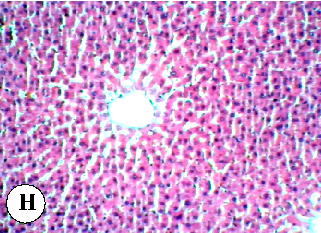
Histopathological examination of liver tissue from control rats, showing normal hepatic architecture for baseline comparison with diazinon-treated groups.
Protective effect of some plant oils on diazinon induced hepatorenal toxicity in …
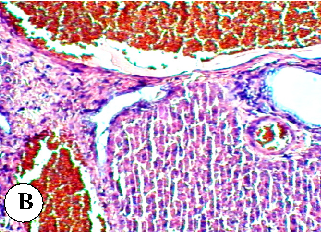
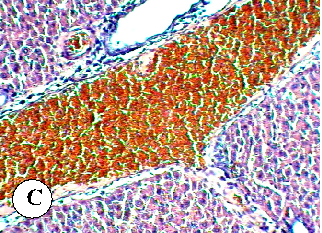
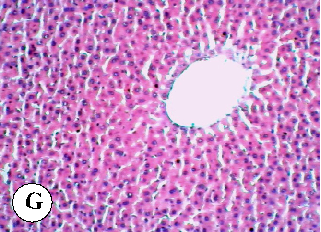
Liver histopathology in diazinon-treated rats showing hepatocellular damage, inflammatory infiltration, and structural changes indicative of pesticide-induced hepatotoxicity.
Protective effect of some plant oils on diazinon induced hepatorenal toxicity in …
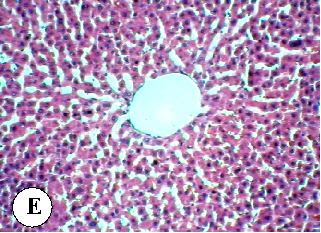
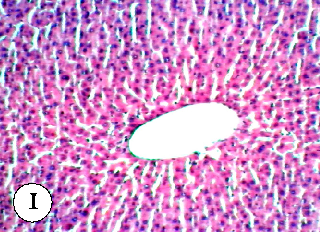
Liver tissue sections from rats co-treated with diazinon and a plant oil, showing varying degrees of protection against pesticide-induced hepatic damage.
Protective effect of some plant oils on diazinon induced hepatorenal toxicity in …
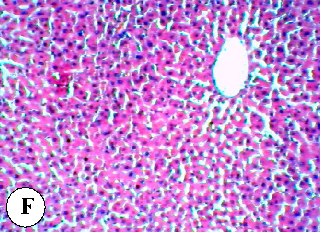
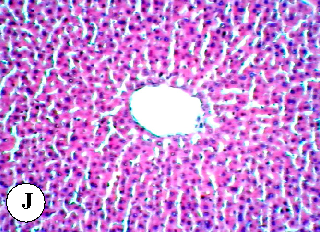
Additional liver histopathology from a different plant oil treatment group, demonstrating the comparative hepatoprotective effects of various plant oils against diazinon toxicity.
Protective effect of some plant oils on diazinon induced hepatorenal toxicity in …
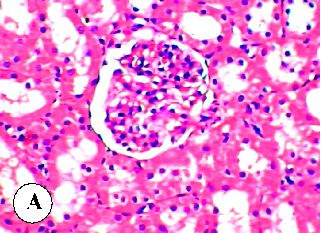
Kidney histopathology from control rats showing normal renal architecture, providing a baseline for comparison with diazinon-exposed groups.
Protective effect of some plant oils on diazinon induced hepatorenal toxicity in …
Renal tissue sections from diazinon-treated rats revealing tubular damage and glomerular changes indicative of nephrotoxicity.
Protective effect of some plant oils on diazinon induced hepatorenal toxicity in …
Kidney histopathology from rats receiving plant oil co-treatment with diazinon, assessing the degree of renal protection afforded by the oil supplement.
Protective effect of some plant oils on diazinon induced hepatorenal toxicity in …
Additional renal tissue examination from a plant oil treatment group, comparing nephroprotective efficacy across different oil types in diazinon-exposed rats.
Protective effect of some plant oils on diazinon induced hepatorenal toxicity in …
Antioxidant enzyme activity measurements (SOD, catalase, or GPx) in liver or kidney tissue across all experimental groups in the diazinon-plant oil study.
Protective effect of some plant oils on diazinon induced hepatorenal toxicity in …
Lipid peroxidation or oxidative damage marker levels in renal tissue of rats treated with diazinon and plant oils.
Protective effect of some plant oils on diazinon induced hepatorenal toxicity in …
Body weight changes or organ weight ratios in rats across the different diazinon and plant oil treatment groups over the study period.
Protective effect of some plant oils on diazinon induced hepatorenal toxicity in …
Page 3 of 7