Research Figures
150 figures from peer-reviewed research
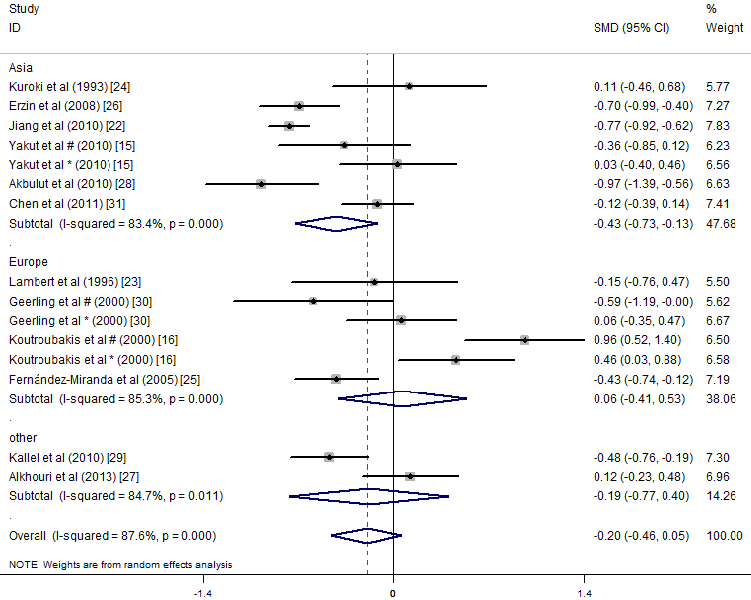
Forest plot of serum vitamin B12 concentrations in IBD patients versus controls, showing standardized mean differences with 95% confidence intervals and weight percentages. Subgroup analysis by disease type reveals differential B12 depletion patterns.
Associations between Folate and Vitamin B12 Levels and Inflammatory Bowel Disease: A …
Additional subgroup or geographic stratification of the meta-analytic results for folate and B12 in IBD, exploring heterogeneity sources across the included studies.
Associations between Folate and Vitamin B12 Levels and Inflammatory Bowel Disease: A …
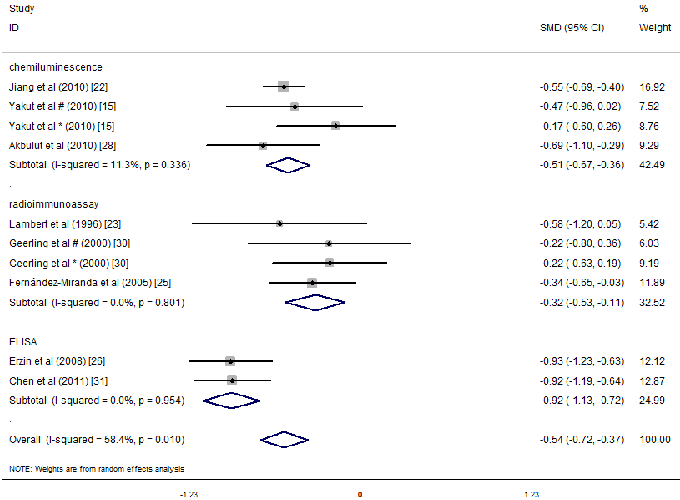
Supplementary forest plot or funnel plot from the meta-analysis of folate and vitamin B12 in inflammatory bowel disease, providing further evidence for the association between IBD and micronutrient insufficiency.
Associations between Folate and Vitamin B12 Levels and Inflammatory Bowel Disease: A …
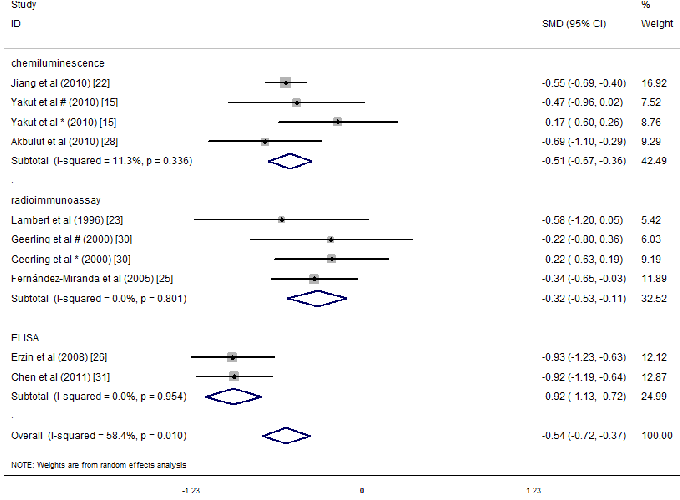
Forest plot of serum folate concentrations in IBD patients versus controls with standardized mean differences and 95% confidence intervals. Results are stratified by subgroup to examine consistency of folate depletion across study populations.
Associations between Folate and Vitamin B12 Levels and Inflammatory Bowel Disease: A …
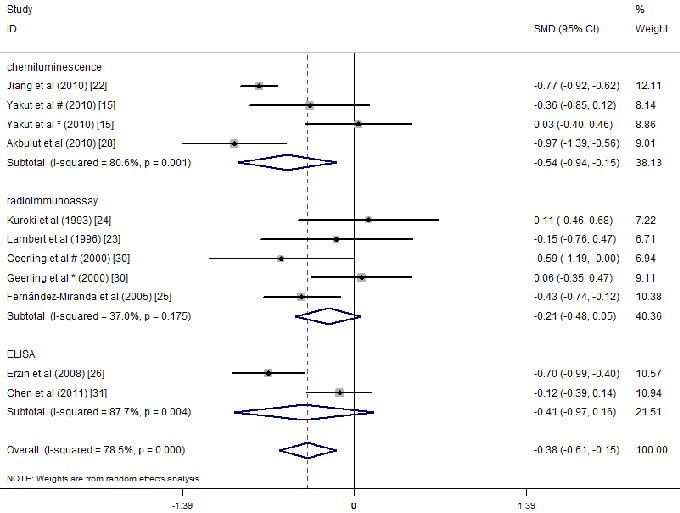
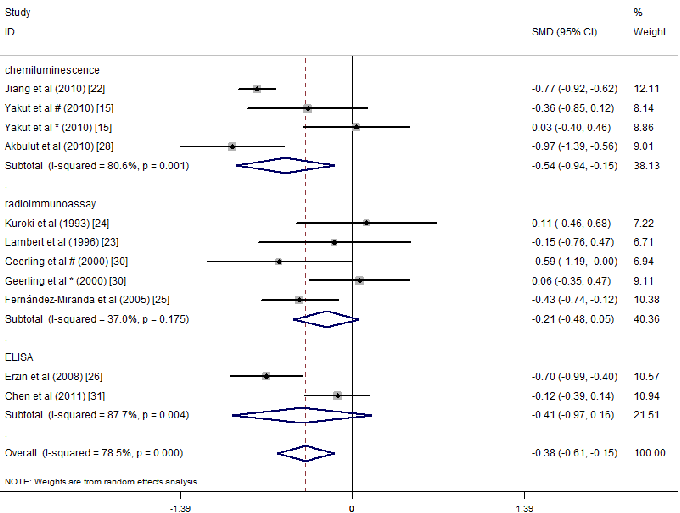
Forest plot of serum vitamin B12 concentrations comparing IBD patients with healthy controls, displaying standardized mean differences, 95% confidence intervals, and weight percentages across all included studies.
Associations between Folate and Vitamin B12 Levels and Inflammatory Bowel Disease: A …
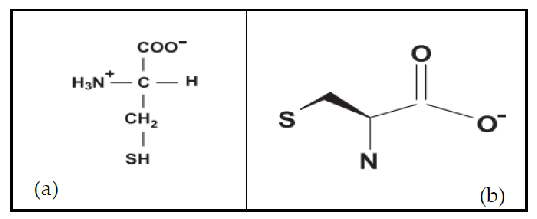
A summary table or figure from the L-cysteine review captures the breadth of health conditions investigated in connection with cysteine supplementation. The comprehensive review analyzed publications across PubMed, Scopus, and Web of Science databases.
Effects of the Usage of l-Cysteine (l-Cys) on Human Health.
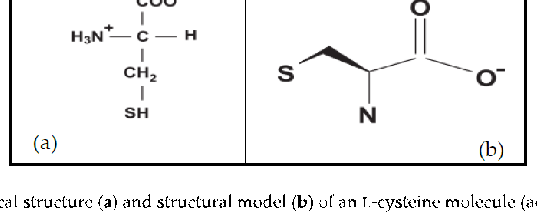
Metabolic fates of L-cysteine in human biochemistry are outlined, including pathways leading to glutathione synthesis, taurine production, and sulfate generation. Each pathway serves distinct physiological functions from antioxidant defense to bile acid conjugation.
Effects of the Usage of l-Cysteine (l-Cys) on Human Health.
Additional metabolic or clinical data related to L-cysteine's health effects are presented. The review encompasses evidence on cysteine's involvement in protein structure, enzyme function, and cellular signaling.
Effects of the Usage of l-Cysteine (l-Cys) on Human Health.
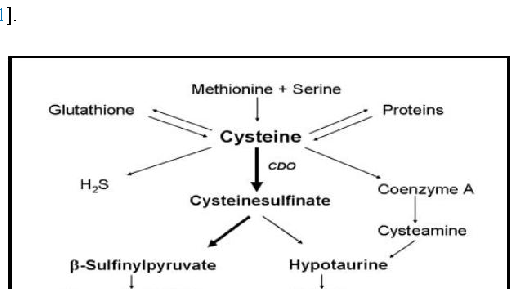
![Figure 2. Summary of cysteine metabolism [8].](https://pdfs.citedhealth.com/figures/29510494/110.png)
Cysteine metabolism is summarized in a pathway diagram showing the interconversion of cysteine with methionine, glutathione, and taurine. The metabolic map highlights key enzymes and intermediates governing sulfur amino acid homeostasis in human tissues.
Effects of the Usage of l-Cysteine (l-Cys) on Human Health.
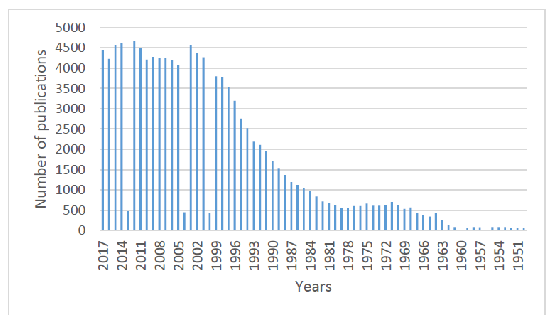
Publication trends for L-cysteine research from 1950 through 2017 reveal a steep increase in scientific output, particularly after 2000. The PubMed-based analysis demonstrates growing interest in cysteine's roles in health and disease over nearly seven decades.
Effects of the Usage of l-Cysteine (l-Cys) on Human Health.
Enzymatic hydrolysis of feather keratin by microbial keratinases is characterized, showing protein fragment profiles. The Bacillus subtilis-derived keratinase produces low molecular weight hydrolysates suitable for hair care applications.
Feather keratin hydrolysates obtained from microbial keratinases: effect on hair fiber.
Molecular weight distribution of the keratin hydrolysates is analyzed, comparing enzymatic products with commercial alternatives. Lower molecular weight peptides penetrate hair fibers more effectively, offering superior protection against chemical and environmental damage.
Feather keratin hydrolysates obtained from microbial keratinases: effect on hair fiber.
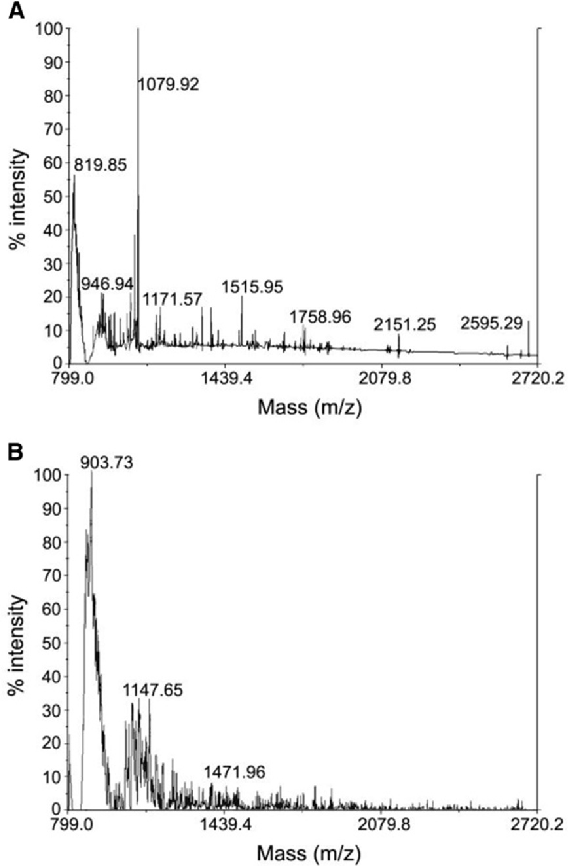
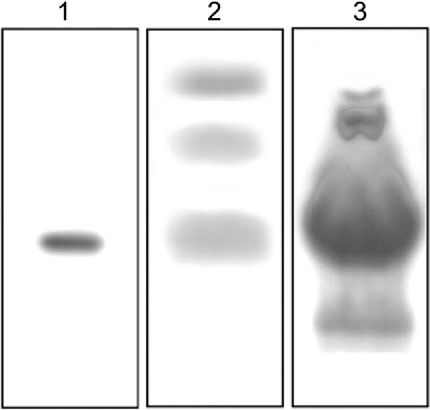
MALDI-TOF mass spectrometry analysis compares enzymatic keratin hydrolysates from Bacillus subtilis with a commercial hydrolysate (KH1). The mass spectra reveal distinct peptide profiles, with the enzymatic product showing a different molecular weight distribution pattern.
Feather keratin hydrolysates obtained from microbial keratinases: effect on hair fiber.
Tensile strength or mechanical properties of hair fibers treated with the enzymatic keratin hydrolysates are measured. The protective effect of low molecular weight protein fragments on hair integrity is quantified against untreated controls.
Feather keratin hydrolysates obtained from microbial keratinases: effect on hair fiber.
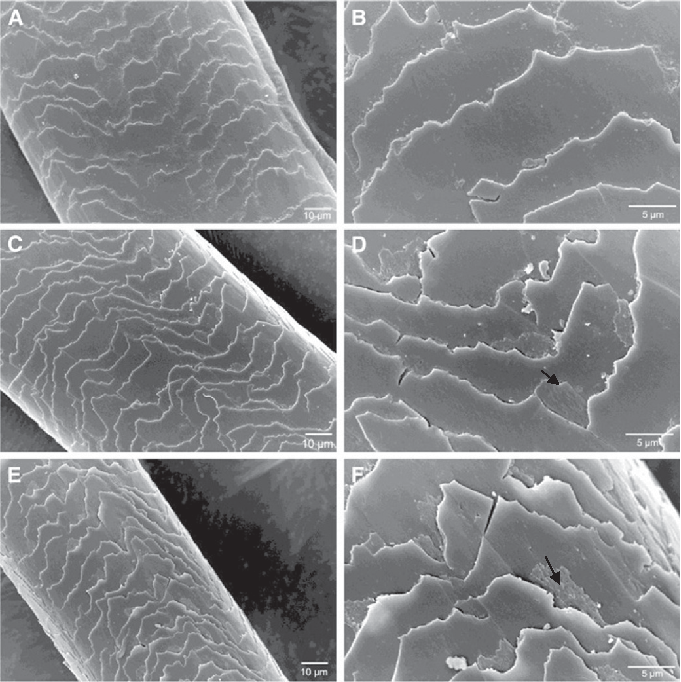
Scanning electron microscopy reveals the surface morphology of colored hair before and after treatment with enzymatic keratin hydrolysates. Treated hair shows smoother cuticle surfaces compared to untreated controls, indicating the hydrolysate's protective and restorative properties following heat styling at 180 degrees Celsius.
Feather keratin hydrolysates obtained from microbial keratinases: effect on hair fiber.
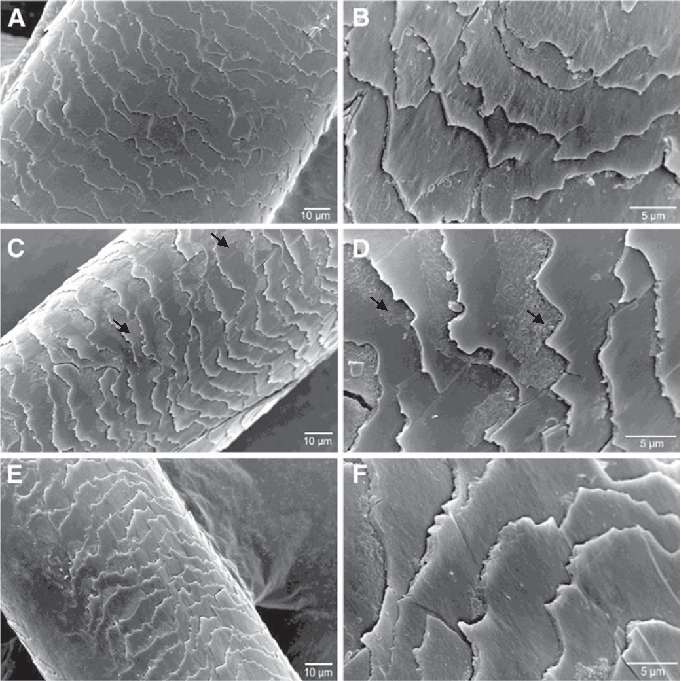
SEM micrographs compare colored and straightened hair treated with enzymatic keratin hydrolysates against controls. The cuticle damage from chemical coloring and heat straightening appears reduced in treated samples, suggesting the hydrolysate provides a protective barrier.
Feather keratin hydrolysates obtained from microbial keratinases: effect on hair fiber.
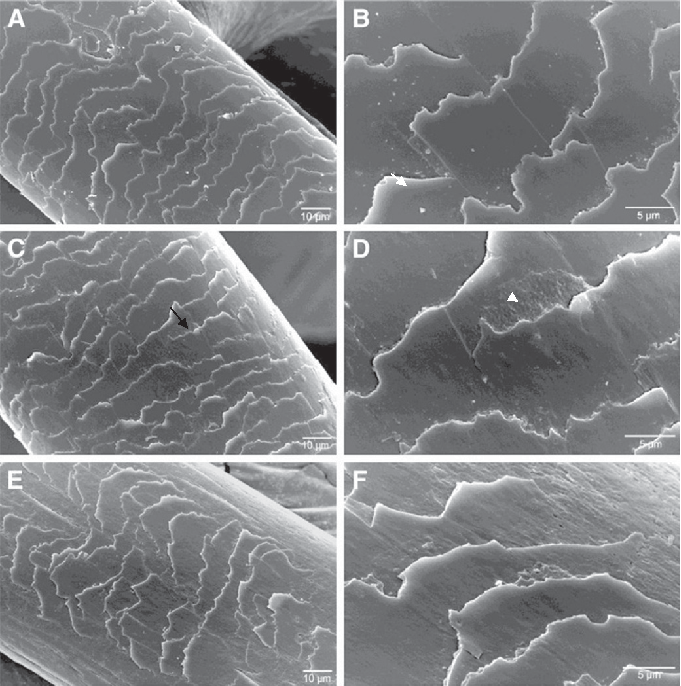
Electronic scanning microscope images show bleached hair before and after enzymatic hydrolysate treatment, with and without heat application. Black arrows indicate areas of cuticle repair where the protein hydrolysate has filled surface defects caused by bleaching.
Feather keratin hydrolysates obtained from microbial keratinases: effect on hair fiber.
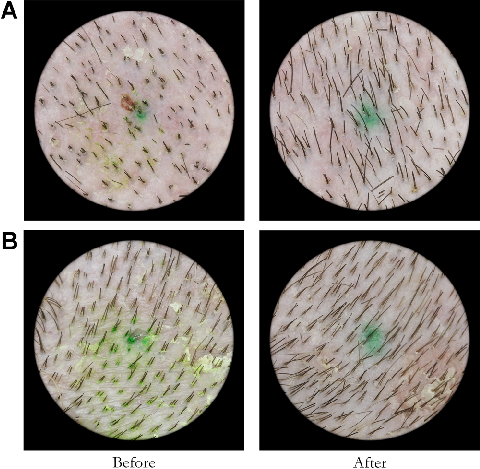
Pre- and post-treatment photographs from the active red light therapy group demonstrate visible increases in hair density, with representative subjects showing hair count improvements from 153 to 221 and 108 to 169 hairs respectively.
The growth of human scalp hair in females using visible red light …
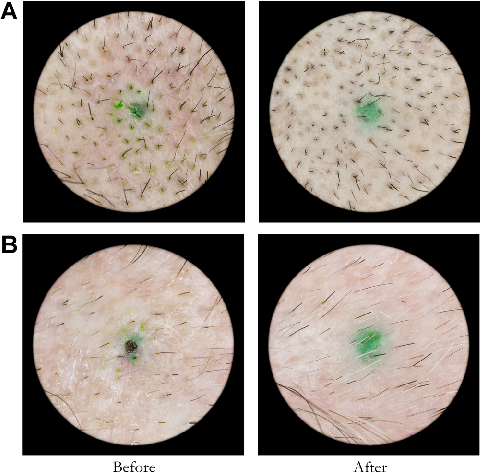
Pre- and post-treatment photographs from the sham device group show minimal changes in hair density, with representative subjects maintaining stable counts of 151 to 166 and 41 to 44 hairs, serving as controls for the red light intervention.
The growth of human scalp hair in females using visible red light …
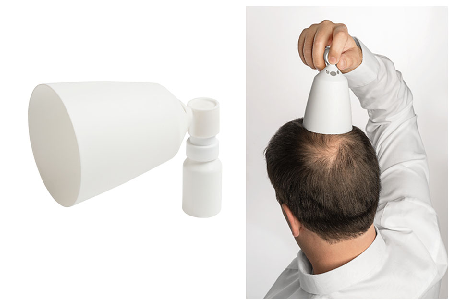
The finasteride 0.25% topical spray applicator and its mode of administration on the scalp are depicted. Developed to minimize systemic exposure compared with oral finasteride, the spray formulation targets hair follicles directly for treatment of male androgenetic alopecia.
Efficacy and safety of topical finasteride spray solution for male androgenetic alopecia: …
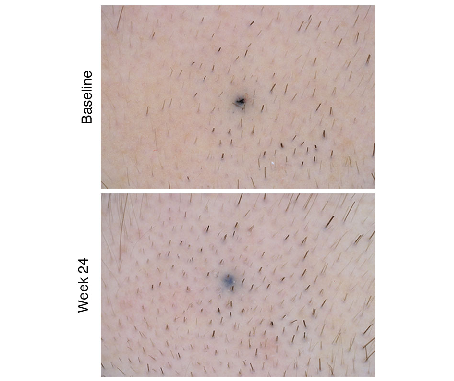
Results from a phase III randomized controlled trial compare the efficacy of topical finasteride spray versus placebo in men with androgenetic alopecia. The data indicate changes in hair count or density over the treatment period, with topical finasteride associated with reduced systemic exposure relative to the oral formulation.
Efficacy and safety of topical finasteride spray solution for male androgenetic alopecia: …
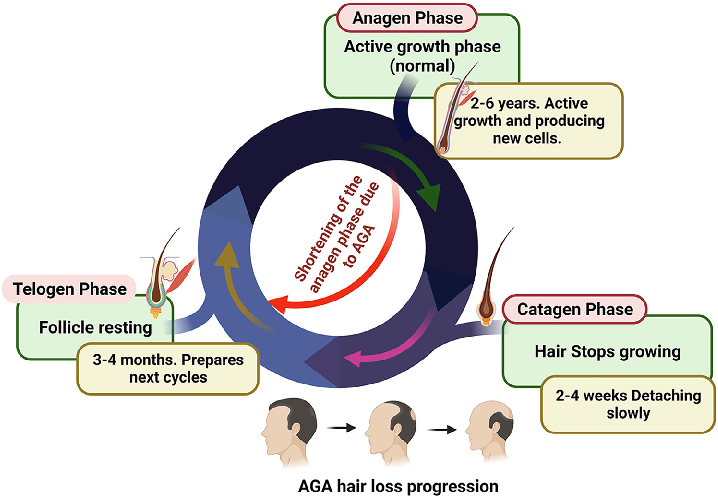
Classification systems for androgenetic alopecia severity are presented, distinguishing male and female pattern hair loss stages.
Androgenetic alopecia: An update.
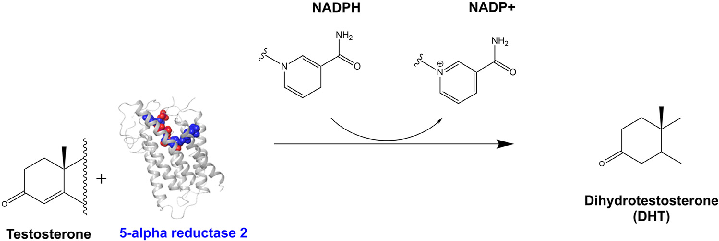
The DHT synthesis pathway via SRD5A2 is diagrammed, showing how 5-alpha reductase converts testosterone to dihydrotestosterone in the presence of NADPH, the key hormonal driver of AGA.
Androgenetic alopecia: An update.
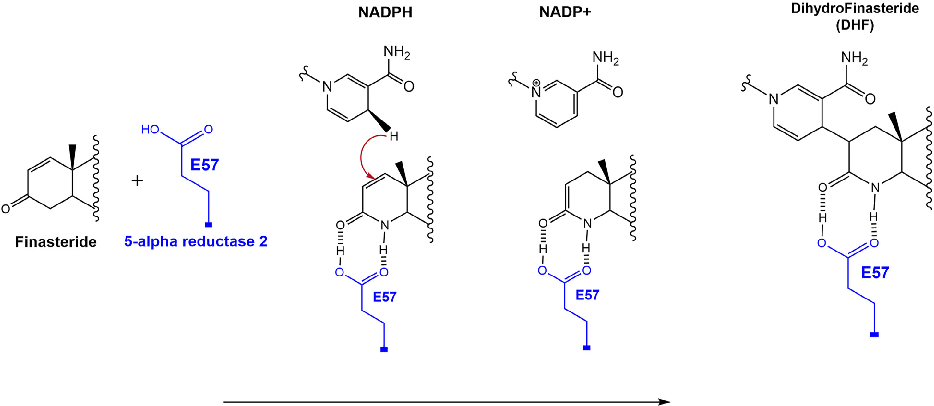
Finasteride's mechanism of inhibition is depicted at the molecular level, showing covalent adduct formation between NADPH and finasteride that prevents further hydride transfer to testosterone.
Androgenetic alopecia: An update.
Page 2 of 7