Acidi grassi Omega-3 Figure
16 figure da ricerca revisionata da esperti
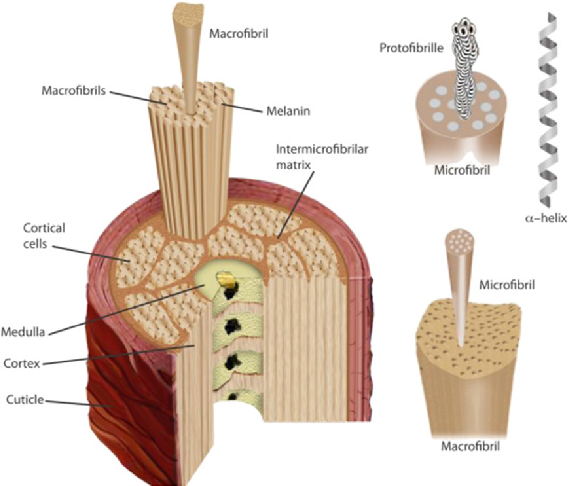
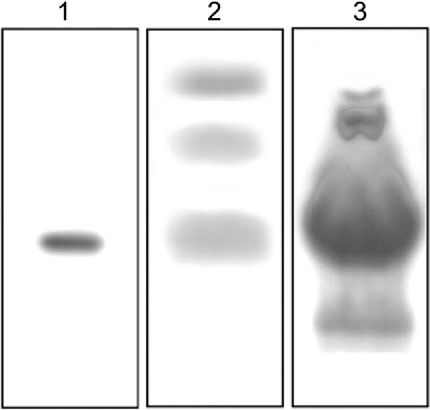
Enzymatic hydrolysis of feather keratin by microbial keratinases is characterized, showing protein fragment profiles. The Bacillus subtilis-derived keratinase produces low molecular weight hydrolysates suitable for hair care applications.
Feather keratin hydrolysates obtained from microbial keratinases: effect on hair fiber.
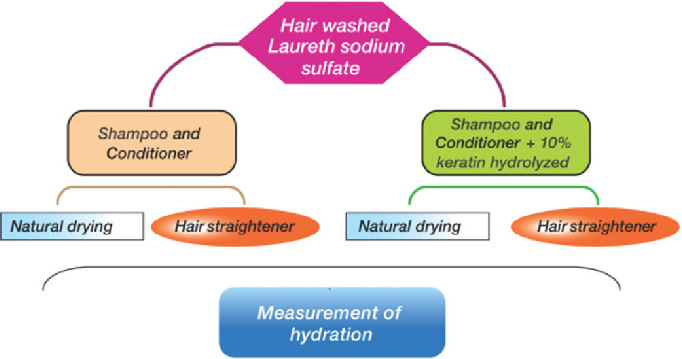
Molecular weight distribution of the keratin hydrolysates is analyzed, comparing enzymatic products with commercial alternatives. Lower molecular weight peptides penetrate hair fibers more effectively, offering superior protection against chemical and environmental damage.
Feather keratin hydrolysates obtained from microbial keratinases: effect on hair fiber.
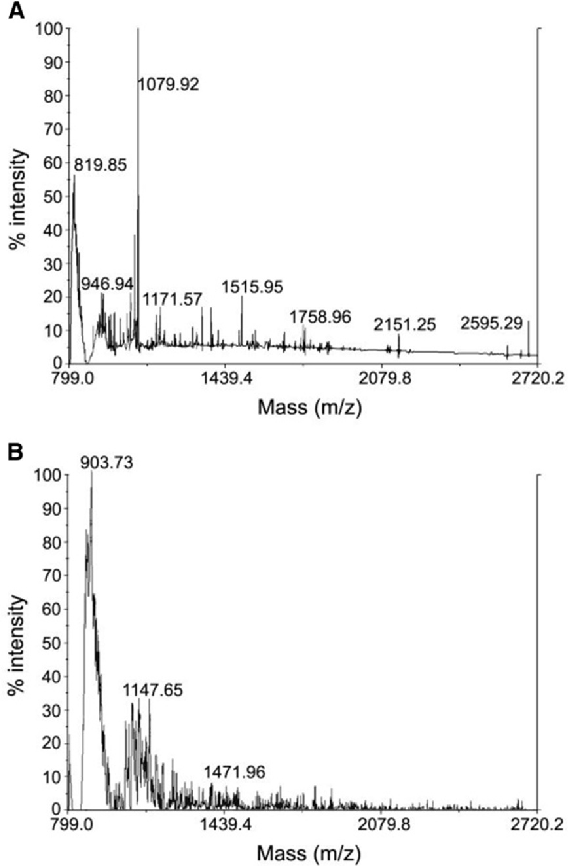
MALDI-TOF mass spectrometry analysis compares enzymatic keratin hydrolysates from Bacillus subtilis with a commercial hydrolysate (KH1). The mass spectra reveal distinct peptide profiles, with the enzymatic product showing a different molecular weight distribution pattern.
Feather keratin hydrolysates obtained from microbial keratinases: effect on hair fiber.
Tensile strength or mechanical properties of hair fibers treated with the enzymatic keratin hydrolysates are measured. The protective effect of low molecular weight protein fragments on hair integrity is quantified against untreated controls.
Feather keratin hydrolysates obtained from microbial keratinases: effect on hair fiber.
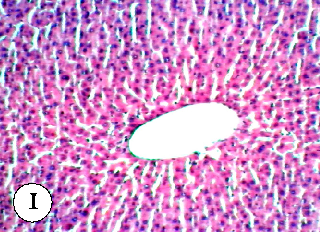
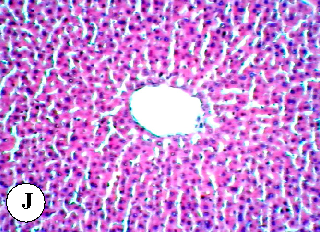
Antioxidant enzyme activity measurements (SOD, catalase, or GPx) in liver or kidney tissue across all experimental groups in the diazinon-plant oil study.
Protective effect of some plant oils on diazinon induced hepatorenal toxicity in …
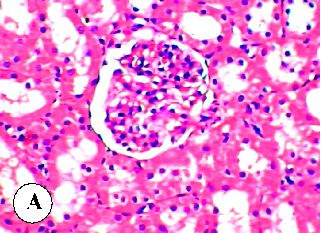
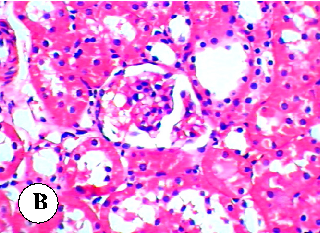
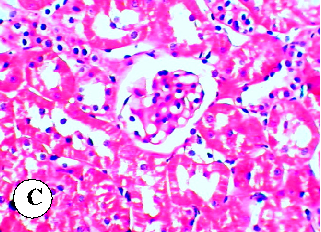
Lipid peroxidation or oxidative damage marker levels in renal tissue of rats treated with diazinon and plant oils.
Protective effect of some plant oils on diazinon induced hepatorenal toxicity in …
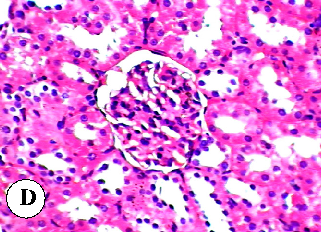
Body weight changes or organ weight ratios in rats across the different diazinon and plant oil treatment groups over the study period.
Protective effect of some plant oils on diazinon induced hepatorenal toxicity in …
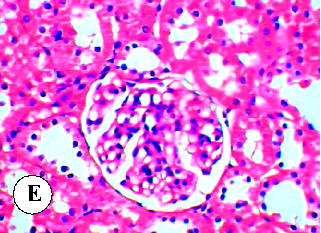
Hematological parameters in diazinon-exposed rats with and without plant oil supplementation, reflecting systemic toxicity effects.
Protective effect of some plant oils on diazinon induced hepatorenal toxicity in …
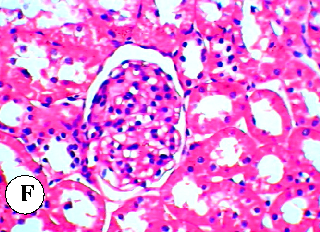
Cholinesterase activity levels in rats treated with diazinon and plant oils, as diazinon is an organophosphate that inhibits acetylcholinesterase.
Protective effect of some plant oils on diazinon induced hepatorenal toxicity in …
Additional biochemical markers in the diazinon-plant oil study, potentially including lipid profile or protein levels across experimental groups.
Protective effect of some plant oils on diazinon induced hepatorenal toxicity in …
Inflammatory marker levels or immunological parameters measured in rats exposed to diazinon with and without plant oil protection.
Protective effect of some plant oils on diazinon induced hepatorenal toxicity in …
Dose-response or time-course data for plant oil protective effects against diazinon-induced hepatorenal toxicity in the rat model.
Protective effect of some plant oils on diazinon induced hepatorenal toxicity in …
Summary comparison of hepatoprotective efficacy across the different plant oils tested in the diazinon toxicity study.
Protective effect of some plant oils on diazinon induced hepatorenal toxicity in …
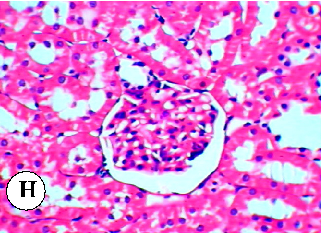
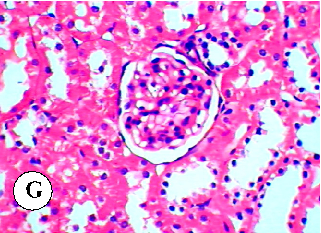
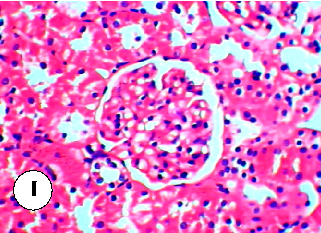
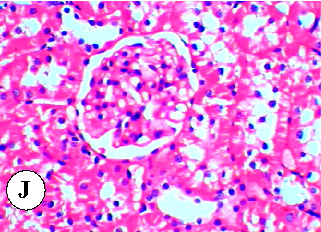
Summary comparison of nephroprotective efficacy across the different plant oils evaluated against diazinon-induced renal damage.
Protective effect of some plant oils on diazinon induced hepatorenal toxicity in …
Supplementary biochemical or histological data from the plant oil-diazinon study, providing additional evidence for the protective mechanisms.
Protective effect of some plant oils on diazinon induced hepatorenal toxicity in …
Final summary data from the hepatorenal toxicity study, consolidating the evidence for plant oil protection against diazinon-induced organ damage in rats.
Protective effect of some plant oils on diazinon induced hepatorenal toxicity in …