Keratin Hình ảnh
19 hình ảnh từ nghiên cứu có bình duyệt
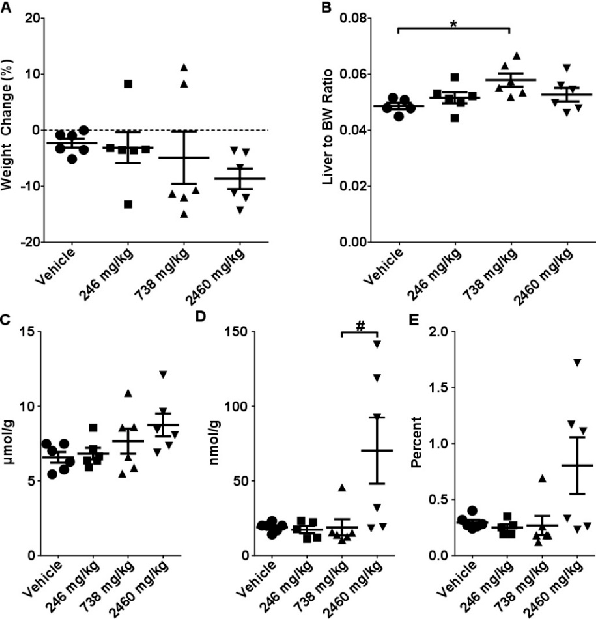
Single gavage with CBD at 246, 738, or 2460 mg/kg produced dose-dependent hepatotoxic effects in mice. Body weight changes, liver-to-body weight ratios, and intrahepatic total glutathione concentrations at 24 hours indicate significant liver burden at the highest doses.
Hepatotoxicity of a Cannabidiol-Rich Cannabis Extract in the Mouse Model.
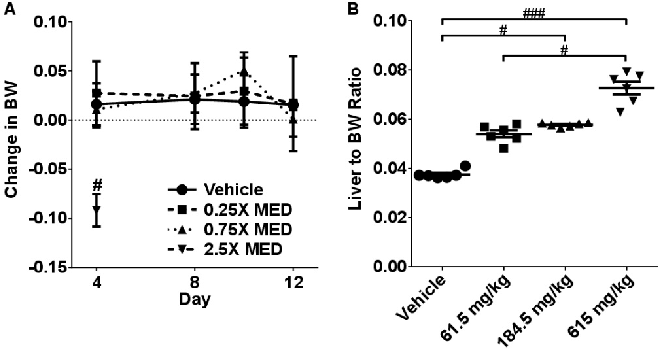
Sub-acute CBD administration (10 daily doses at 61.5-615 mg/kg) produced cumulative hepatic effects. This figure presents body weight curves and liver enzyme data from the two-week dosing protocol.
Hepatotoxicity of a Cannabidiol-Rich Cannabis Extract in the Mouse Model.
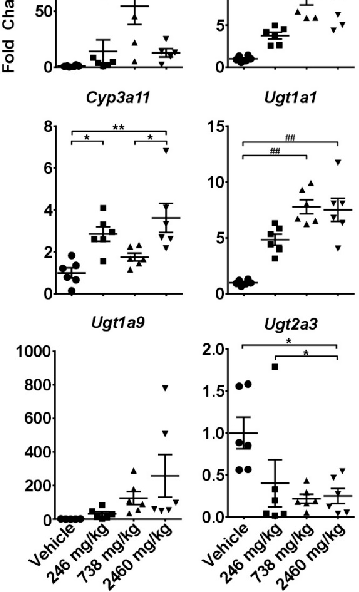
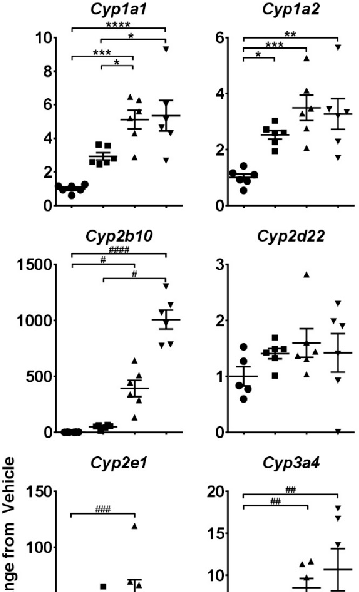
Single CBD gavage induced significant changes in hepatic cytochrome P450 and UDP-glucuronosyltransferase expression. Quantitative real-time PCR data demonstrate dose-dependent upregulation of these xenobiotic-metabolizing enzymes at 24 hours post-treatment.
Hepatotoxicity of a Cannabidiol-Rich Cannabis Extract in the Mouse Model.
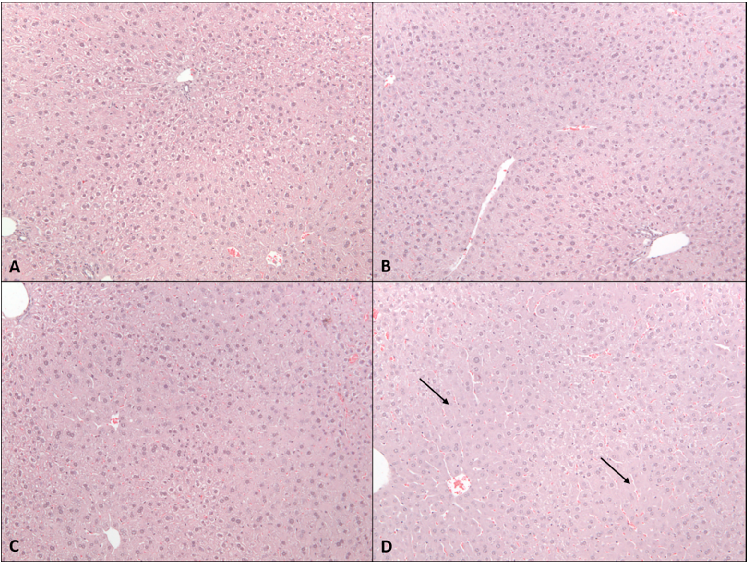
Hematoxylin and eosin-stained liver sections reveal dose-dependent histomorphological changes after 2-week CBD administration. Mice receiving 615 mg/kg CBD exhibited notable hepatocellular alterations compared to vehicle controls and lower-dose groups.
Hepatotoxicity of a Cannabidiol-Rich Cannabis Extract in the Mouse Model.
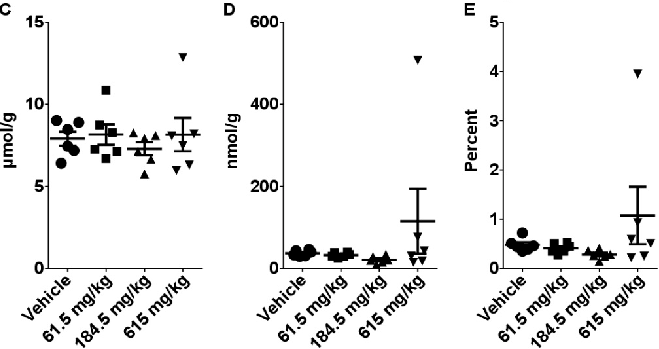
Sub-acute CBD dosing produced changes in liver weight and serum biochemistry parameters. This figure compiles multi-parameter hepatotoxicity data from the 10-day dosing study.
Hepatotoxicity of a Cannabidiol-Rich Cannabis Extract in the Mouse Model.
Hepatic gene expression profiling after sub-acute CBD treatment reveals broader metabolic impacts. This figure presents transcriptomic data on stress-response and metabolism-related genes in the liver.
Hepatotoxicity of a Cannabidiol-Rich Cannabis Extract in the Mouse Model.
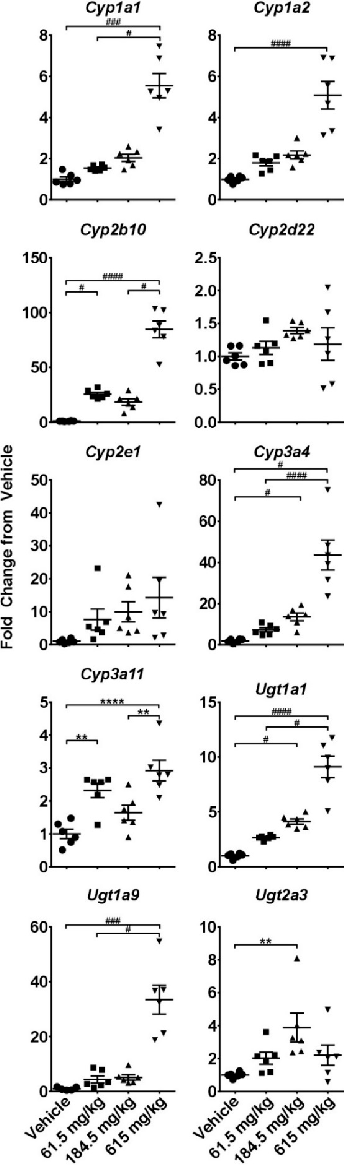
Two-week CBD administration produced sustained changes in cytochrome P450 and UDP-glucuronosyltransferase gene expression. Quantitative PCR data collected 6 hours after the last gavage indicate persistent hepatic enzyme induction at higher CBD doses.
Hepatotoxicity of a Cannabidiol-Rich Cannabis Extract in the Mouse Model.
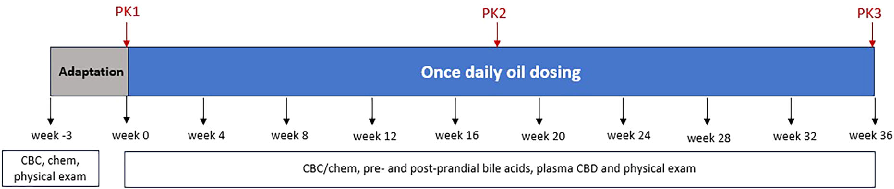
Tolerability of long-term cannabidiol supplementation to healthy adult dogs.
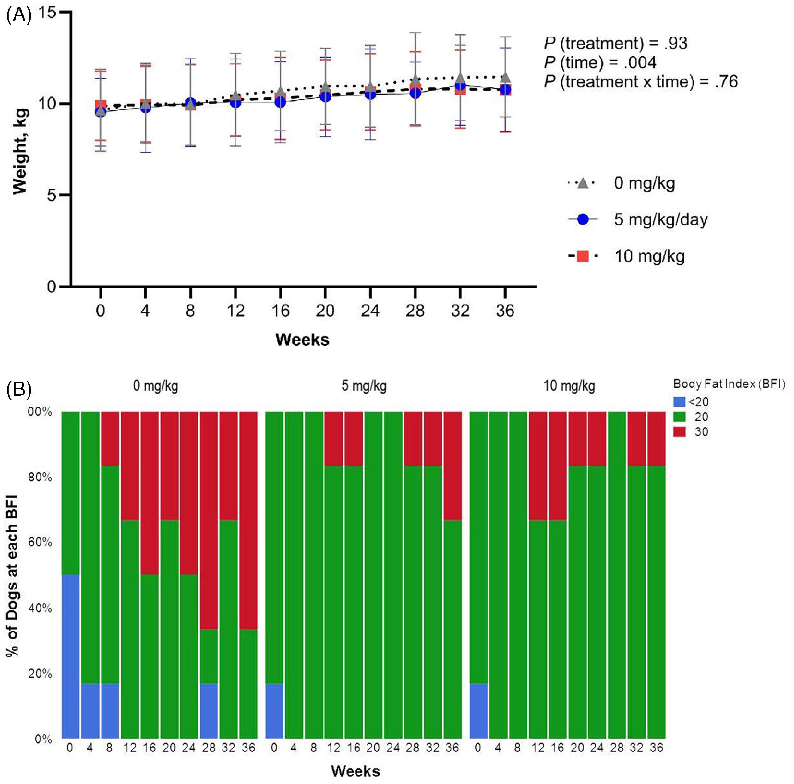
Tolerability of long-term cannabidiol supplementation to healthy adult dogs.
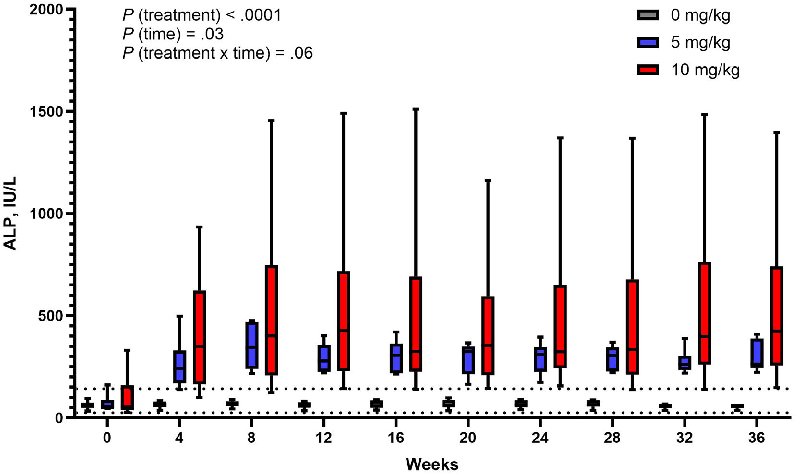
Tolerability of long-term cannabidiol supplementation to healthy adult dogs.
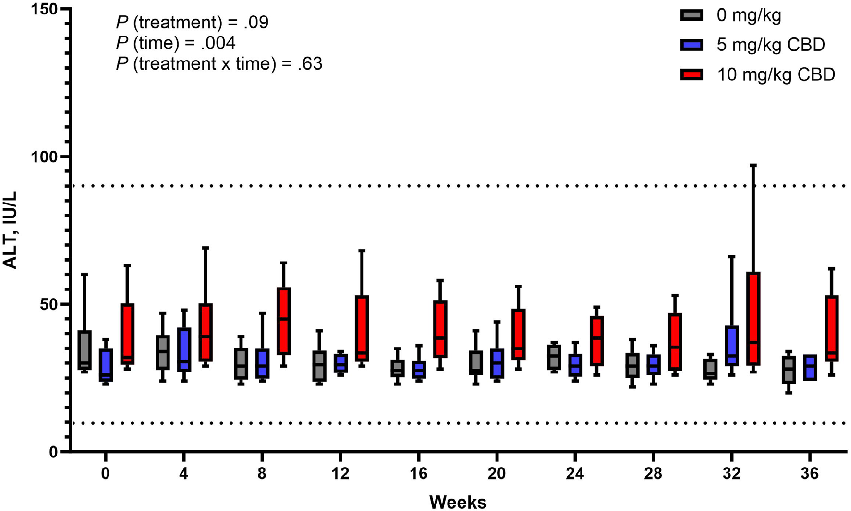
Tolerability of long-term cannabidiol supplementation to healthy adult dogs.
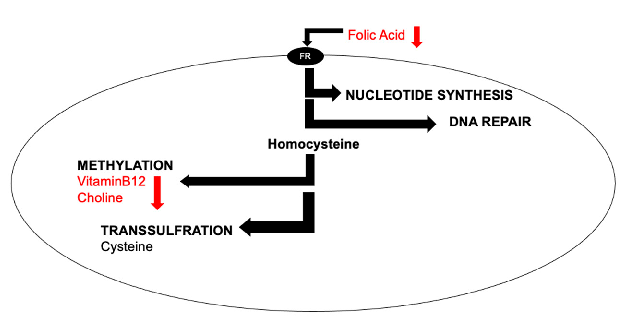
Simplified overview of cellular one-carbon metabolism pathways, illustrating how B-vitamins (folic acid, vitamin B12, choline) participate in nucleotide synthesis, DNA repair, methylation, and transsulfuration reactions relevant to brain health.
The Role of One-Carbon Metabolism in Healthy Brain Aging.
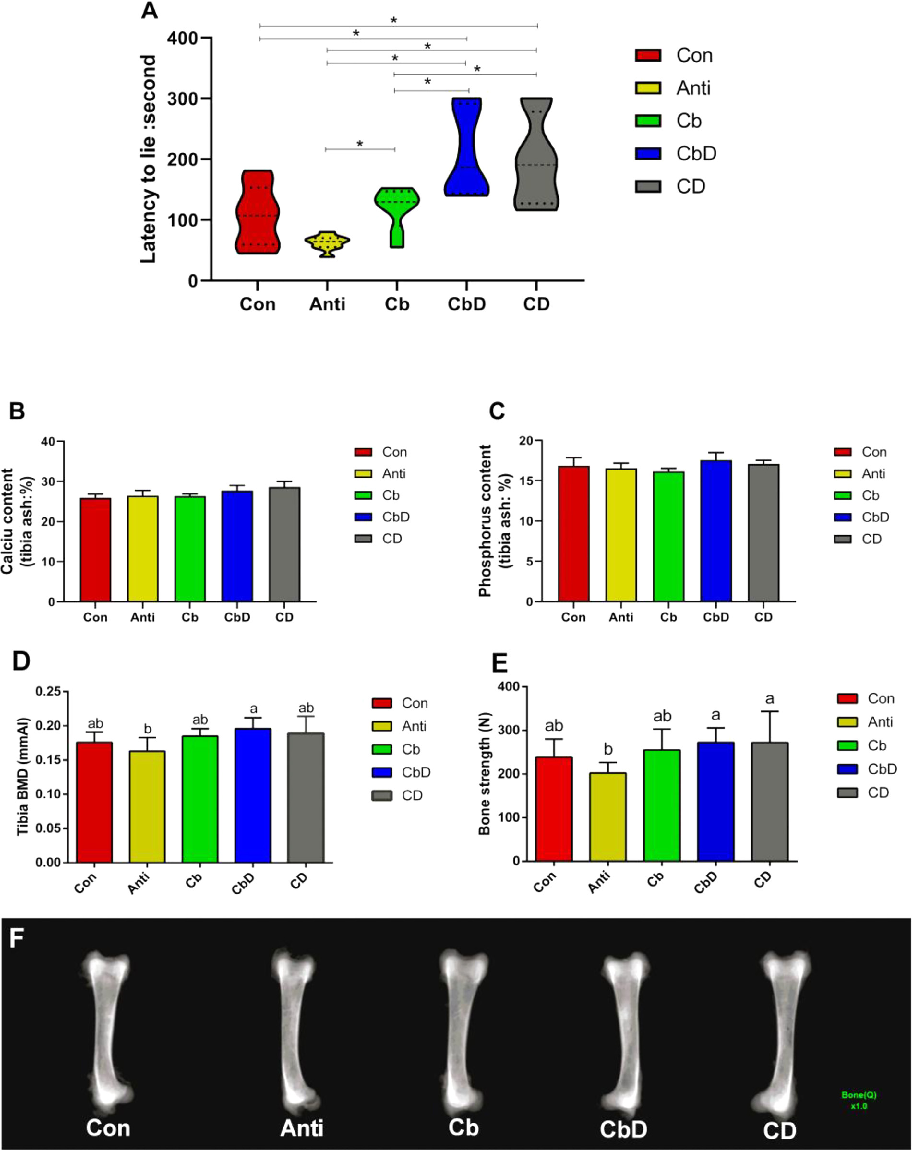
Effects of dietary Clostridium butyricum and 25-hydroxyvitamin D3 supplementation on latency-to-lie time in a poultry model, indicating improvements in leg health and bone strength.
Dietary Clostridium butyricum and 25-Hydroxyvitamin D3 modulate bone metabolism of broilers through …
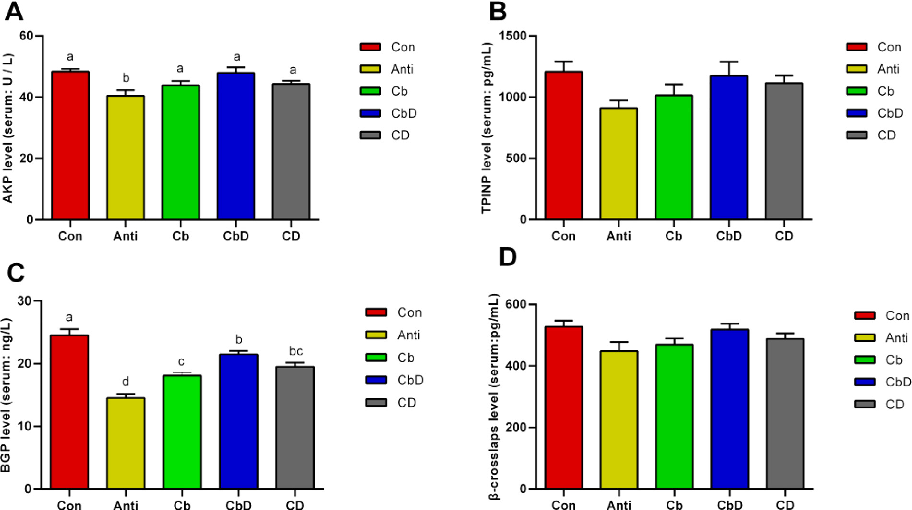
Experimental data from a study on dietary Clostridium butyricum and 25-hydroxyvitamin D3 and their combined effects on bone metabolism through gut microbiota modulation in poultry.
Dietary Clostridium butyricum and 25-Hydroxyvitamin D3 modulate bone metabolism of broilers through …
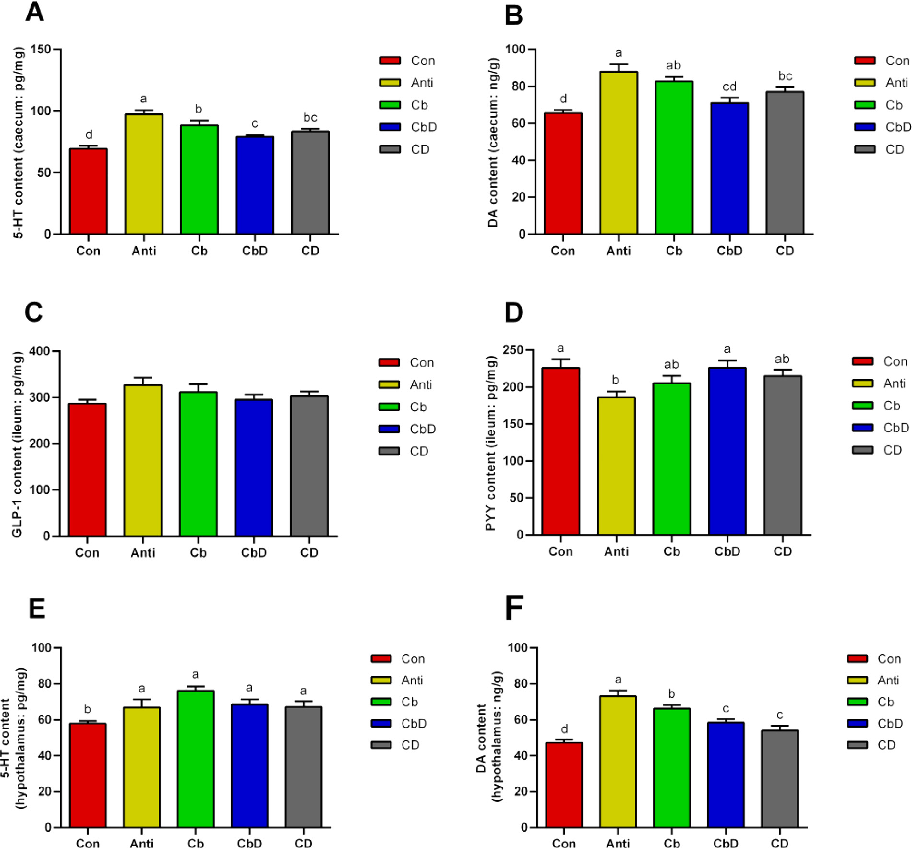
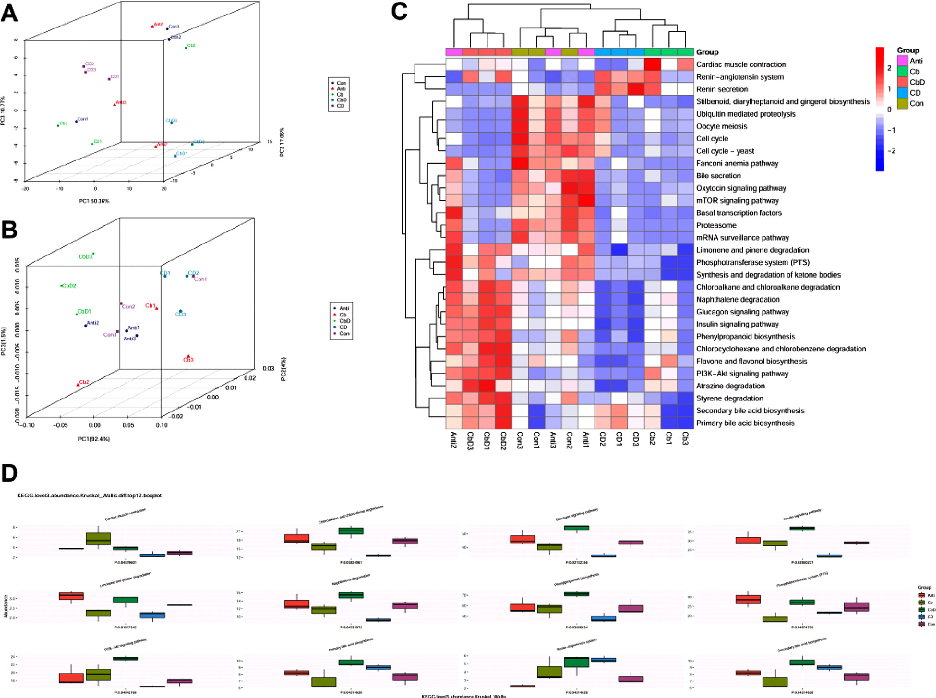
Hypothalamic signaling pathway analysis in poultry fed Clostridium butyricum and 25-hydroxyvitamin D3, examining effects on bone metabolism regulatory mechanisms.
Dietary Clostridium butyricum and 25-Hydroxyvitamin D3 modulate bone metabolism of broilers through …
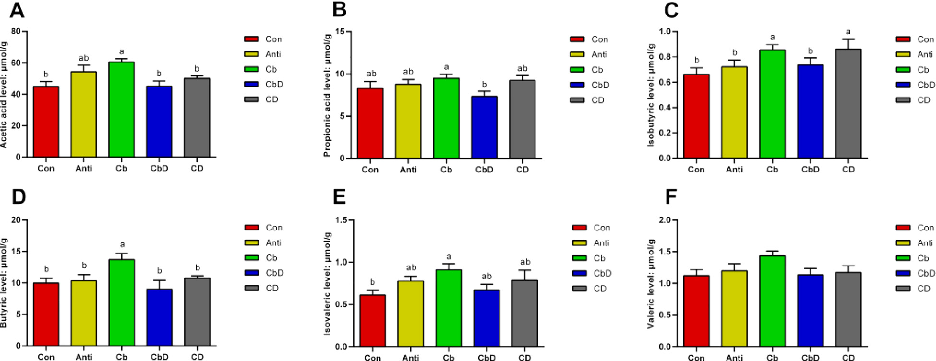
Caecal short-chain fatty acid (SCFA) concentrations in poultry supplemented with Clostridium butyricum and 25-hydroxyvitamin D3, linking gut fermentation products to bone metabolism modulation.
Dietary Clostridium butyricum and 25-Hydroxyvitamin D3 modulate bone metabolism of broilers through …
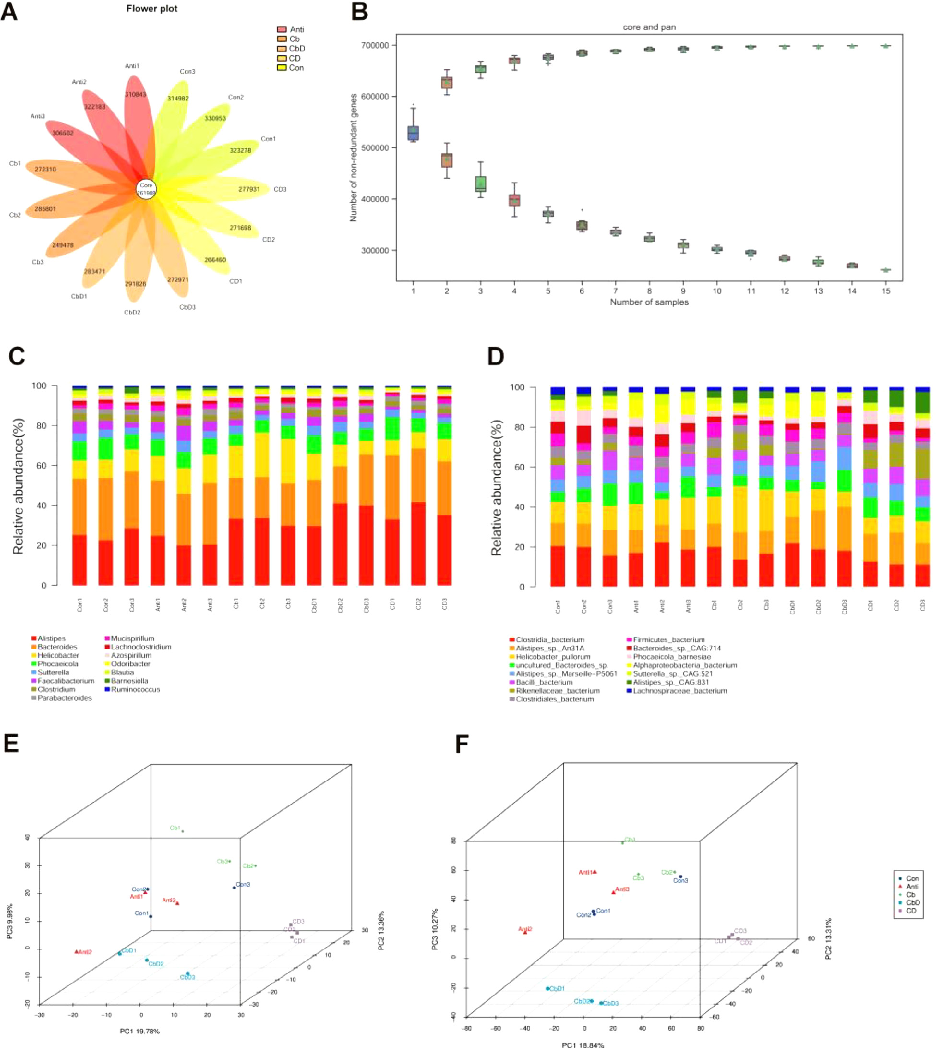
Metagenomic analysis of caecal microbiota in poultry receiving Clostridium butyricum and 25-hydroxyvitamin D3 supplementation, revealing shifts in microbial community structure.
Dietary Clostridium butyricum and 25-Hydroxyvitamin D3 modulate bone metabolism of broilers through …
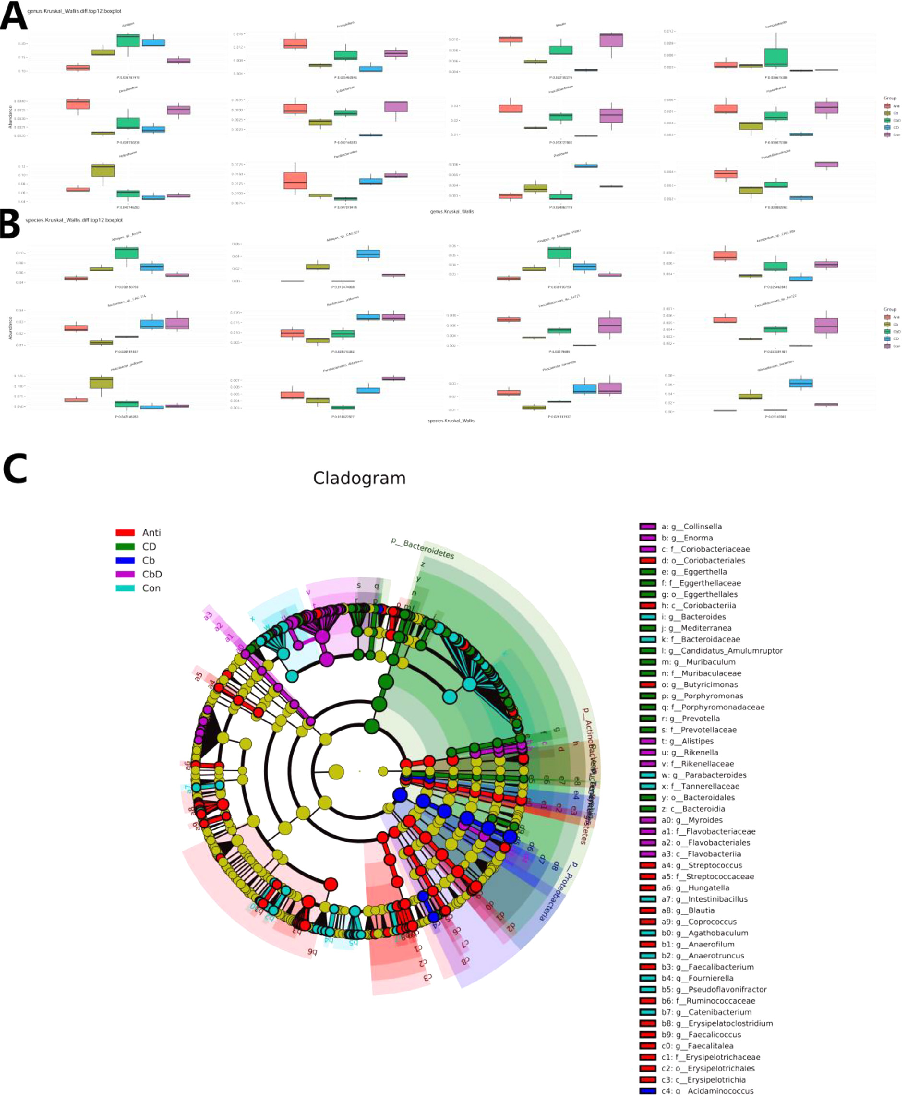
Caecal microbial composition data from poultry treated with Clostridium butyricum and 25-hydroxyvitamin D3, showing taxonomic-level changes associated with improved bone metabolism.
Dietary Clostridium butyricum and 25-Hydroxyvitamin D3 modulate bone metabolism of broilers through …
Metagenomic analysis of caecal microbiota in poultry receiving Clostridium butyricum and 25-hydroxyvitamin D3 supplementation, revealing shifts in microbial community structure.
Dietary Clostridium butyricum and 25-Hydroxyvitamin D3 modulate bone metabolism of broilers through …