MSM Рисунки
13 иллюстрации из рецензируемых исследований
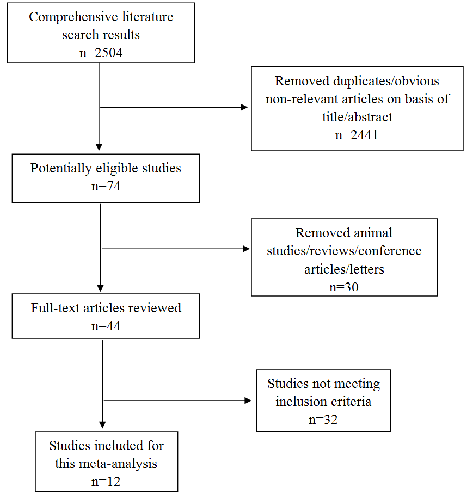
PRISMA flow diagram showing the literature search strategy, screening process, and final study selection for a meta-analysis of folate and vitamin B12 levels in inflammatory bowel disease.
Associations between Folate and Vitamin B12 Levels and Inflammatory Bowel Disease: A …
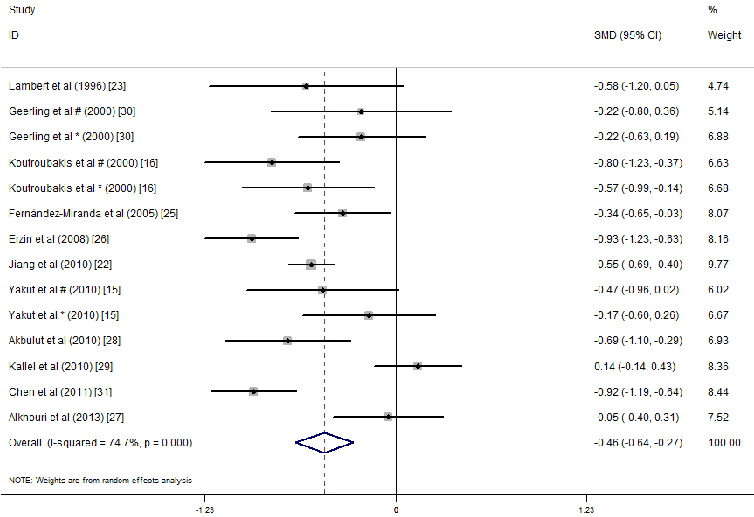
Forest plot displaying pooled effect sizes or summary statistics from one of the meta-analytic comparisons of micronutrient concentrations between IBD patients and healthy individuals.
Associations between Folate and Vitamin B12 Levels and Inflammatory Bowel Disease: A …
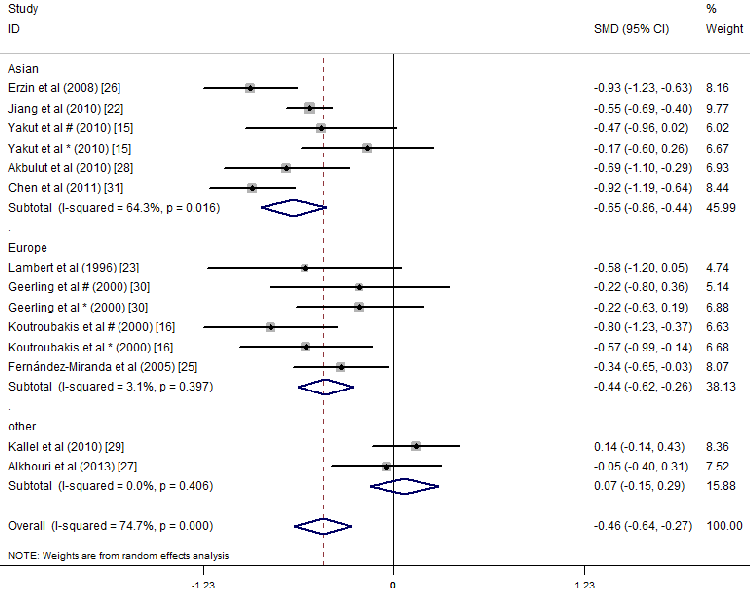
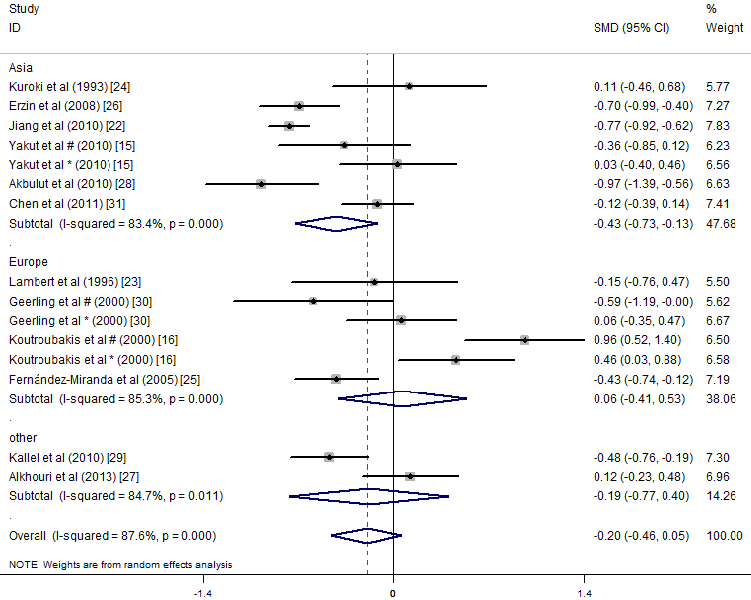
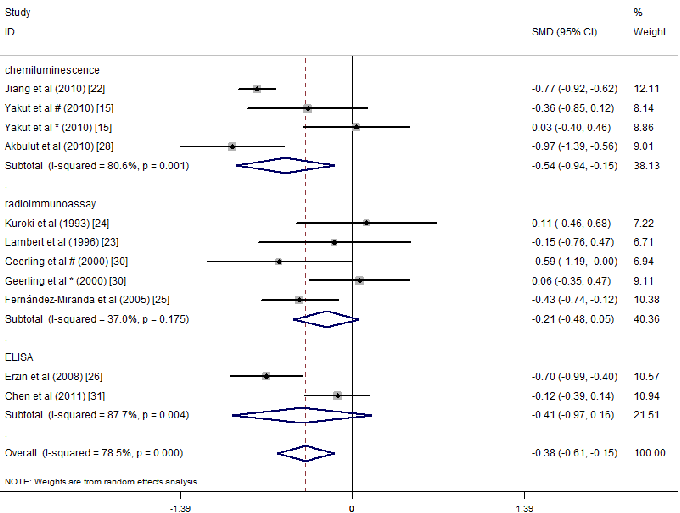
Subgroup or sensitivity analysis from the IBD meta-analysis, examining whether disease type, geographic location, or study design influences the observed associations with folate or B12 status.
Associations between Folate and Vitamin B12 Levels and Inflammatory Bowel Disease: A …
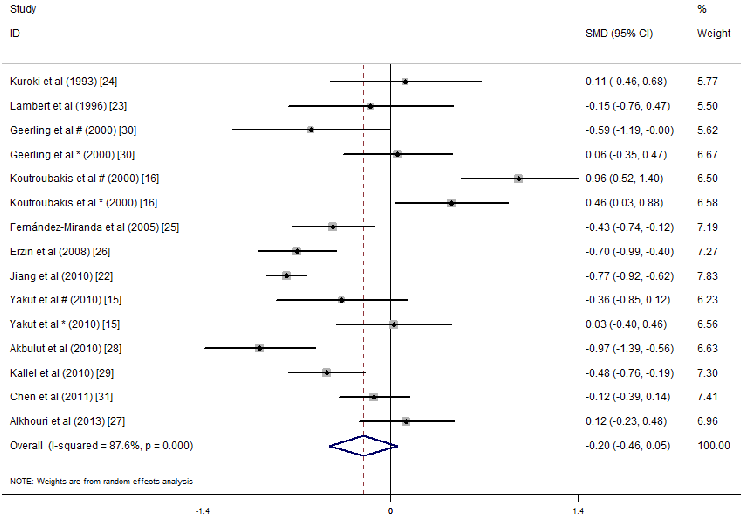
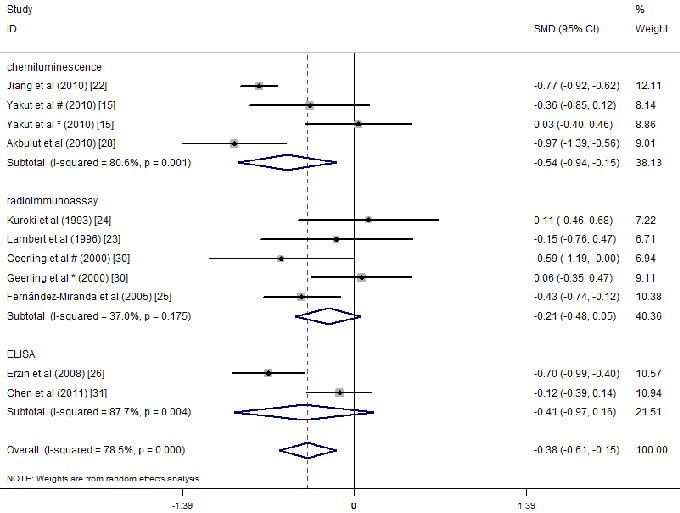
Forest plot comparing serum folate concentrations between IBD patients and controls, with standardized mean differences, 95% confidence intervals, and study weights displayed for each included investigation.
Associations between Folate and Vitamin B12 Levels and Inflammatory Bowel Disease: A …
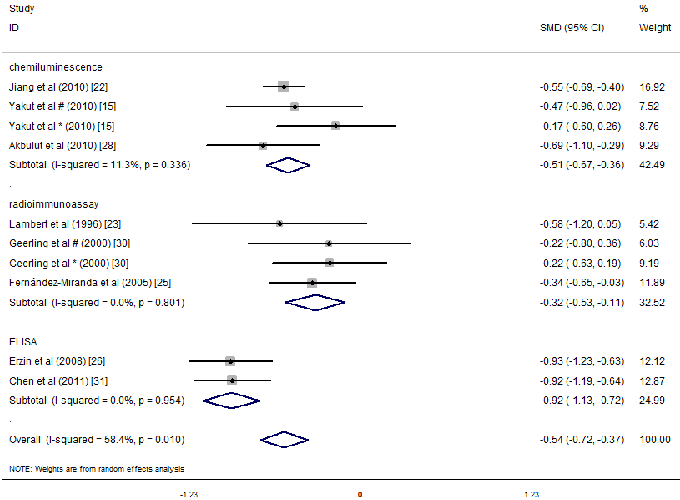
Funnel plot or additional sensitivity analysis evaluating publication bias in the meta-analysis of folate and vitamin B12 levels in inflammatory bowel disease.
Associations between Folate and Vitamin B12 Levels and Inflammatory Bowel Disease: A …
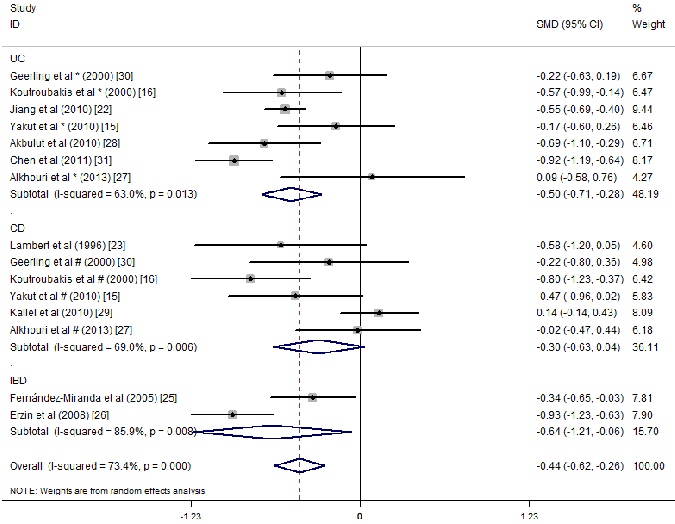
Subgroup analysis stratifying the folate or B12 meta-analysis results by Crohn's disease versus ulcerative colitis, revealing potential differences in micronutrient depletion between IBD subtypes.
Associations between Folate and Vitamin B12 Levels and Inflammatory Bowel Disease: A …
Leave-one-out sensitivity analysis or cumulative meta-analysis assessing the robustness of the pooled effect estimate for micronutrient status differences in IBD.
Associations between Folate and Vitamin B12 Levels and Inflammatory Bowel Disease: A …
Forest plot of serum folate concentrations in IBD patients versus controls, presenting standardized mean differences with 95% confidence intervals. Subtotals are stratified by IBD subtype to examine disease-specific patterns.
Associations between Folate and Vitamin B12 Levels and Inflammatory Bowel Disease: A …
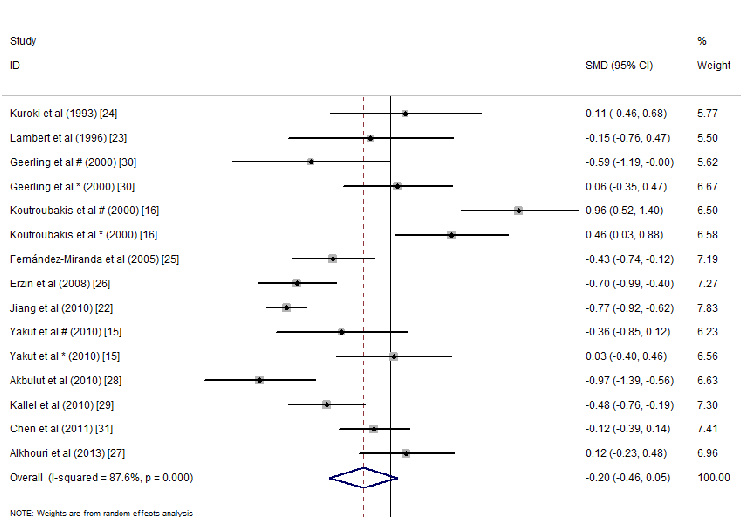
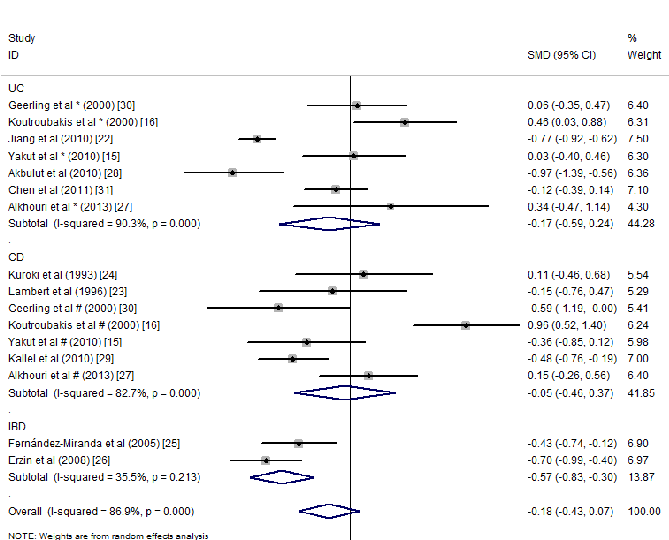
Forest plot of serum vitamin B12 concentrations in IBD patients versus controls, showing standardized mean differences with 95% confidence intervals and weight percentages. Subgroup analysis by disease type reveals differential B12 depletion patterns.
Associations between Folate and Vitamin B12 Levels and Inflammatory Bowel Disease: A …
Additional subgroup or geographic stratification of the meta-analytic results for folate and B12 in IBD, exploring heterogeneity sources across the included studies.
Associations between Folate and Vitamin B12 Levels and Inflammatory Bowel Disease: A …
Supplementary forest plot or funnel plot from the meta-analysis of folate and vitamin B12 in inflammatory bowel disease, providing further evidence for the association between IBD and micronutrient insufficiency.
Associations between Folate and Vitamin B12 Levels and Inflammatory Bowel Disease: A …
Forest plot of serum folate concentrations in IBD patients versus controls with standardized mean differences and 95% confidence intervals. Results are stratified by subgroup to examine consistency of folate depletion across study populations.
Associations between Folate and Vitamin B12 Levels and Inflammatory Bowel Disease: A …
Forest plot of serum vitamin B12 concentrations comparing IBD patients with healthy controls, displaying standardized mean differences, 95% confidence intervals, and weight percentages across all included studies.
Associations between Folate and Vitamin B12 Levels and Inflammatory Bowel Disease: A …