أحماض أوميغا-3 الدهنية الأشكال
30 أشكال من أبحاث محكّمة
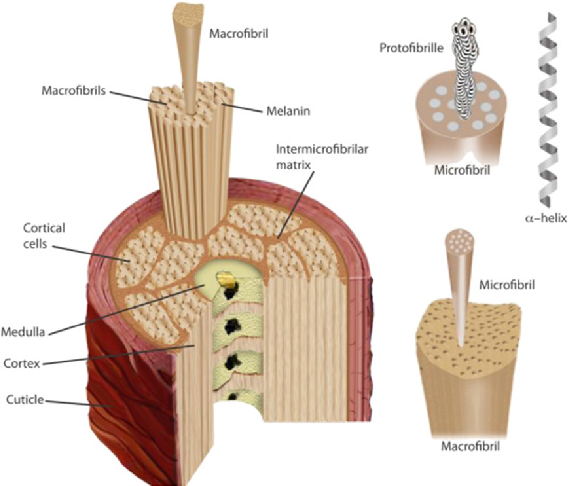
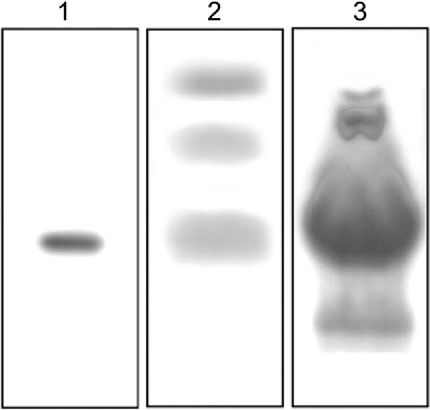
Enzymatic hydrolysis of feather keratin by microbial keratinases is characterized, showing protein fragment profiles. The Bacillus subtilis-derived keratinase produces low molecular weight hydrolysates suitable for hair care applications.
Feather keratin hydrolysates obtained from microbial keratinases: effect on hair fiber.
Molecular weight distribution of the keratin hydrolysates is analyzed, comparing enzymatic products with commercial alternatives. Lower molecular weight peptides penetrate hair fibers more effectively, offering superior protection against chemical and environmental damage.
Feather keratin hydrolysates obtained from microbial keratinases: effect on hair fiber.
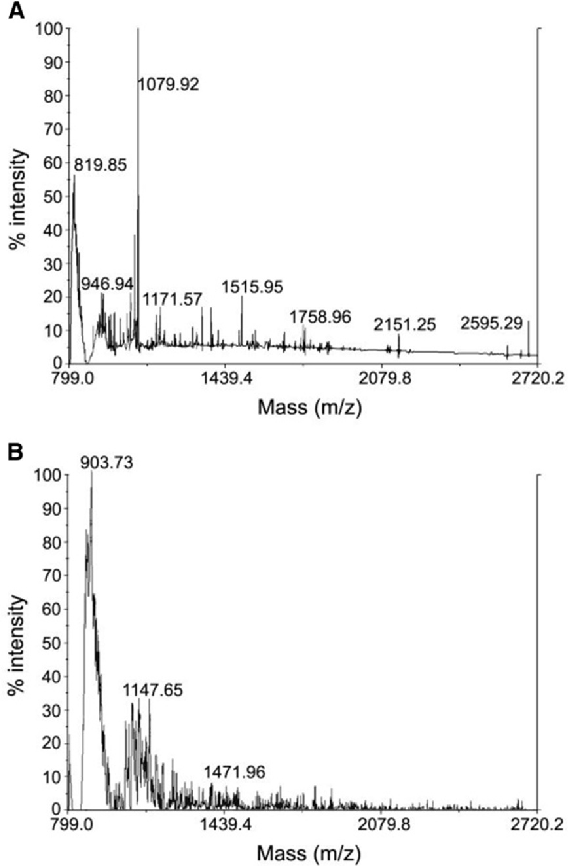
MALDI-TOF mass spectrometry analysis compares enzymatic keratin hydrolysates from Bacillus subtilis with a commercial hydrolysate (KH1). The mass spectra reveal distinct peptide profiles, with the enzymatic product showing a different molecular weight distribution pattern.
Feather keratin hydrolysates obtained from microbial keratinases: effect on hair fiber.
Tensile strength or mechanical properties of hair fibers treated with the enzymatic keratin hydrolysates are measured. The protective effect of low molecular weight protein fragments on hair integrity is quantified against untreated controls.
Feather keratin hydrolysates obtained from microbial keratinases: effect on hair fiber.
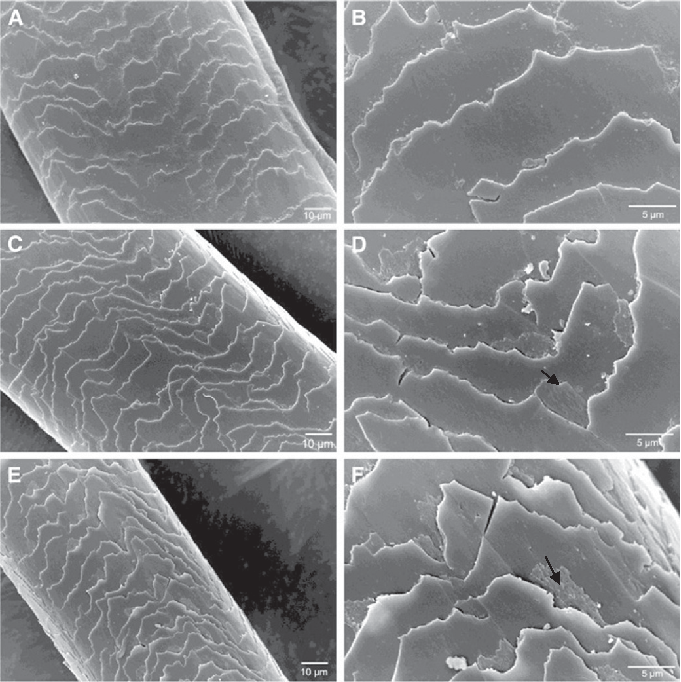
Scanning electron microscopy reveals the surface morphology of colored hair before and after treatment with enzymatic keratin hydrolysates. Treated hair shows smoother cuticle surfaces compared to untreated controls, indicating the hydrolysate's protective and restorative properties following heat styling at 180 degrees Celsius.
Feather keratin hydrolysates obtained from microbial keratinases: effect on hair fiber.
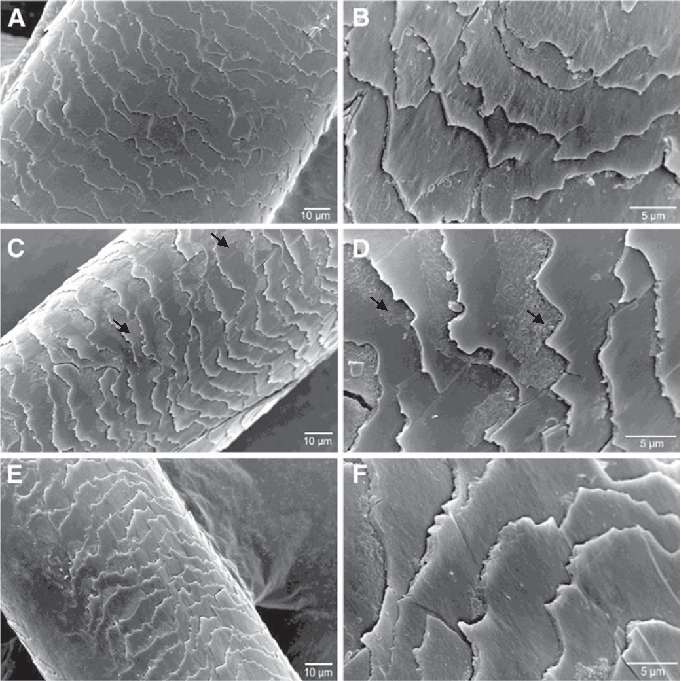
SEM micrographs compare colored and straightened hair treated with enzymatic keratin hydrolysates against controls. The cuticle damage from chemical coloring and heat straightening appears reduced in treated samples, suggesting the hydrolysate provides a protective barrier.
Feather keratin hydrolysates obtained from microbial keratinases: effect on hair fiber.
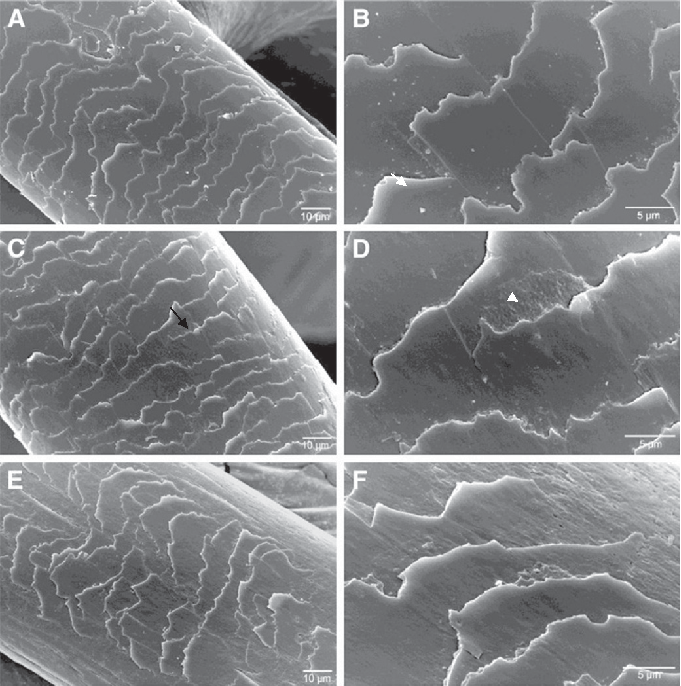
Electronic scanning microscope images show bleached hair before and after enzymatic hydrolysate treatment, with and without heat application. Black arrows indicate areas of cuticle repair where the protein hydrolysate has filled surface defects caused by bleaching.
Feather keratin hydrolysates obtained from microbial keratinases: effect on hair fiber.
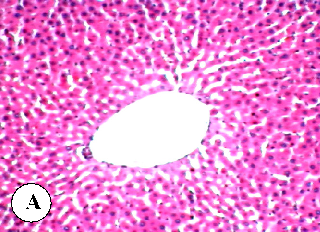
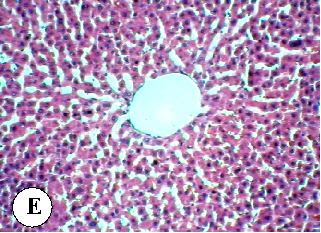
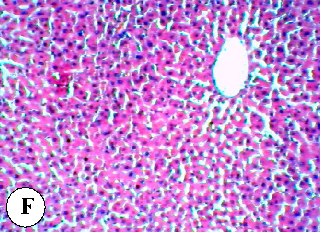
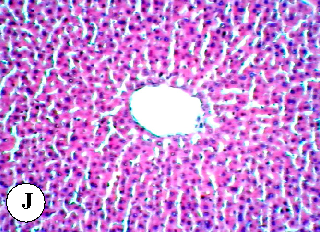
Histopathological examination of liver tissue from control rats, showing normal hepatic architecture for baseline comparison with diazinon-treated groups.
Protective effect of some plant oils on diazinon induced hepatorenal toxicity in …
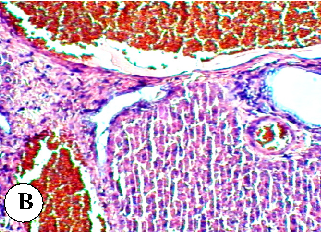
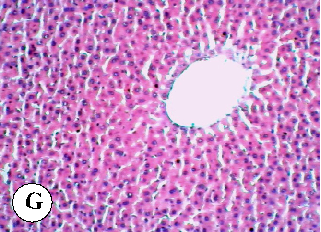
Liver histopathology in diazinon-treated rats showing hepatocellular damage, inflammatory infiltration, and structural changes indicative of pesticide-induced hepatotoxicity.
Protective effect of some plant oils on diazinon induced hepatorenal toxicity in …
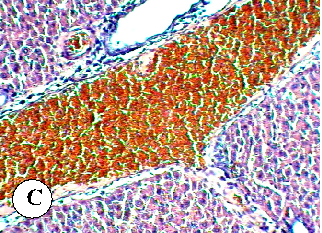
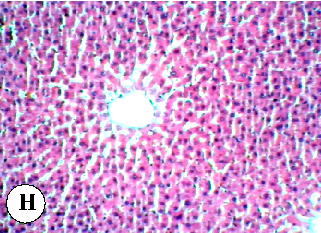
Liver tissue sections from rats co-treated with diazinon and a plant oil, showing varying degrees of protection against pesticide-induced hepatic damage.
Protective effect of some plant oils on diazinon induced hepatorenal toxicity in …
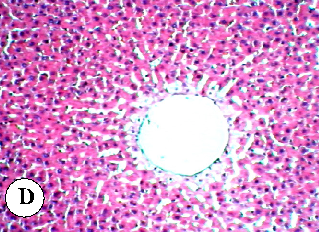
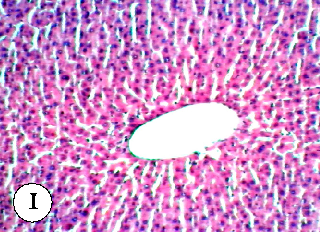
Additional liver histopathology from a different plant oil treatment group, demonstrating the comparative hepatoprotective effects of various plant oils against diazinon toxicity.
Protective effect of some plant oils on diazinon induced hepatorenal toxicity in …
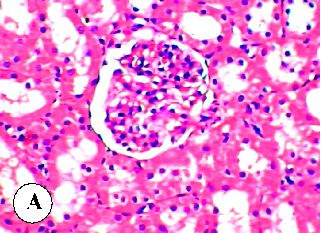
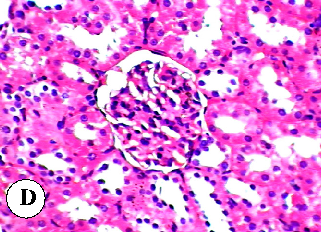
Kidney histopathology from control rats showing normal renal architecture, providing a baseline for comparison with diazinon-exposed groups.
Protective effect of some plant oils on diazinon induced hepatorenal toxicity in …
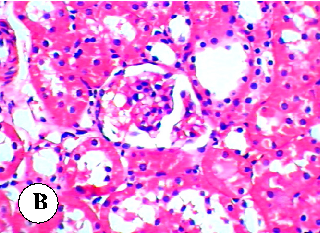
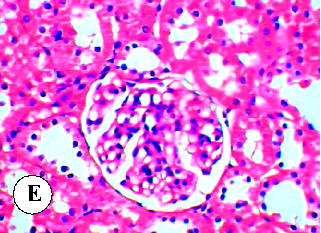
Renal tissue sections from diazinon-treated rats revealing tubular damage and glomerular changes indicative of nephrotoxicity.
Protective effect of some plant oils on diazinon induced hepatorenal toxicity in …
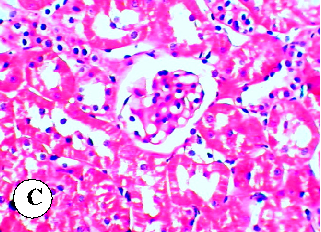
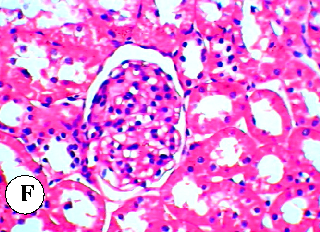
Kidney histopathology from rats receiving plant oil co-treatment with diazinon, assessing the degree of renal protection afforded by the oil supplement.
Protective effect of some plant oils on diazinon induced hepatorenal toxicity in …
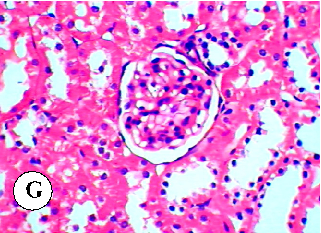
Additional renal tissue examination from a plant oil treatment group, comparing nephroprotective efficacy across different oil types in diazinon-exposed rats.
Protective effect of some plant oils on diazinon induced hepatorenal toxicity in …
Antioxidant enzyme activity measurements (SOD, catalase, or GPx) in liver or kidney tissue across all experimental groups in the diazinon-plant oil study.
Protective effect of some plant oils on diazinon induced hepatorenal toxicity in …
Lipid peroxidation or oxidative damage marker levels in renal tissue of rats treated with diazinon and plant oils.
Protective effect of some plant oils on diazinon induced hepatorenal toxicity in …
Body weight changes or organ weight ratios in rats across the different diazinon and plant oil treatment groups over the study period.
Protective effect of some plant oils on diazinon induced hepatorenal toxicity in …
Hematological parameters in diazinon-exposed rats with and without plant oil supplementation, reflecting systemic toxicity effects.
Protective effect of some plant oils on diazinon induced hepatorenal toxicity in …
Cholinesterase activity levels in rats treated with diazinon and plant oils, as diazinon is an organophosphate that inhibits acetylcholinesterase.
Protective effect of some plant oils on diazinon induced hepatorenal toxicity in …
Additional biochemical markers in the diazinon-plant oil study, potentially including lipid profile or protein levels across experimental groups.
Protective effect of some plant oils on diazinon induced hepatorenal toxicity in …
Inflammatory marker levels or immunological parameters measured in rats exposed to diazinon with and without plant oil protection.
Protective effect of some plant oils on diazinon induced hepatorenal toxicity in …
Dose-response or time-course data for plant oil protective effects against diazinon-induced hepatorenal toxicity in the rat model.
Protective effect of some plant oils on diazinon induced hepatorenal toxicity in …
Summary comparison of hepatoprotective efficacy across the different plant oils tested in the diazinon toxicity study.
Protective effect of some plant oils on diazinon induced hepatorenal toxicity in …
الصفحة 1 من 2