الوصف
Forest plot of serum folate concentrations in IBD patients versus controls, presenting standardized mean differences with 95% confidence intervals. Subtotals are stratified by IBD subtype to examine disease-specific patterns.
More Figures from This Paper
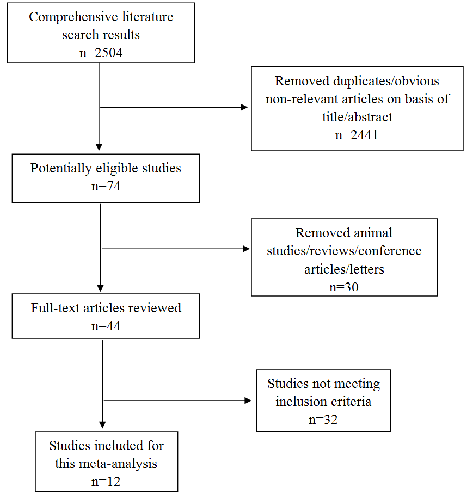
Figure 5
PRISMA flow diagram showing the literature search strategy, screening process, and final study selection for a meta-analysis of folate and vitamin B12 levels in inflammatory bowel disease.
flowchart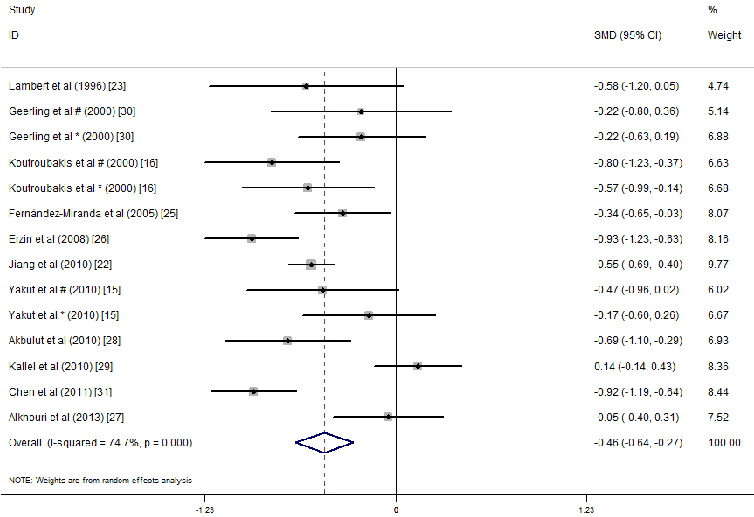
Figure 6
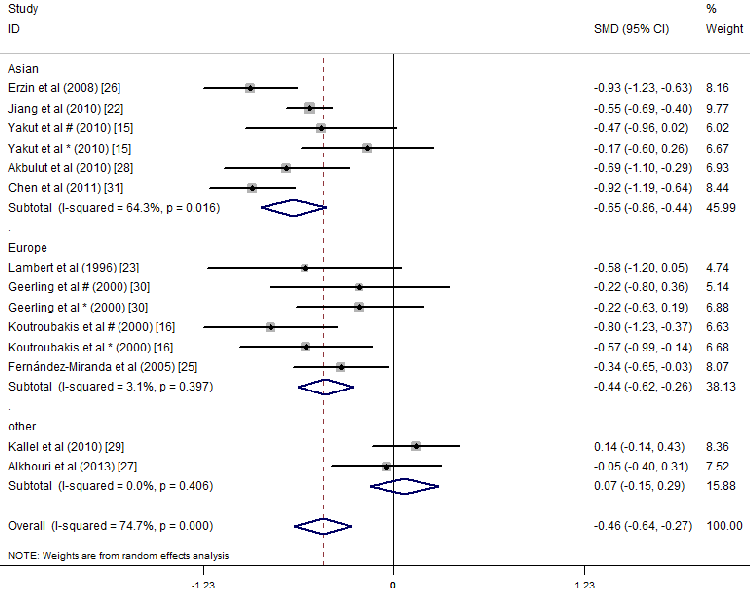
Forest plot displaying pooled effect sizes or summary statistics from one of the meta-analytic comparisons of micronutrient concentrations between IBD patients and healthy individuals.
forest_plot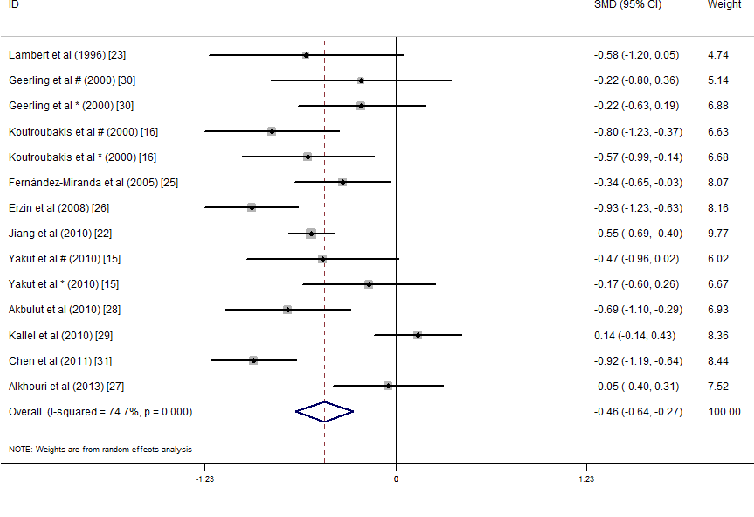
Figure 7
Subgroup or sensitivity analysis from the IBD meta-analysis, examining whether disease type, geographic location, or study design influences the observed associations with folate or B12 status.
forest_plot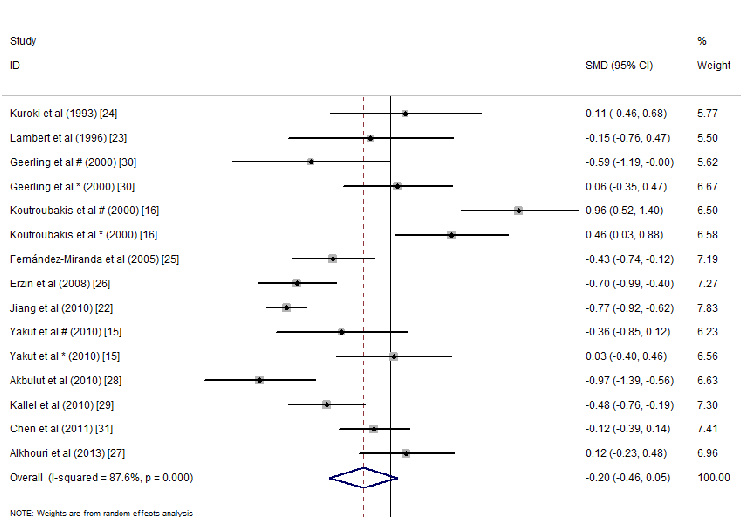
Figure 8
Forest plot comparing serum folate concentrations between IBD patients and controls, with standardized mean differences, 95% confidence intervals, and study weights displayed for each included investigation.
forest_plot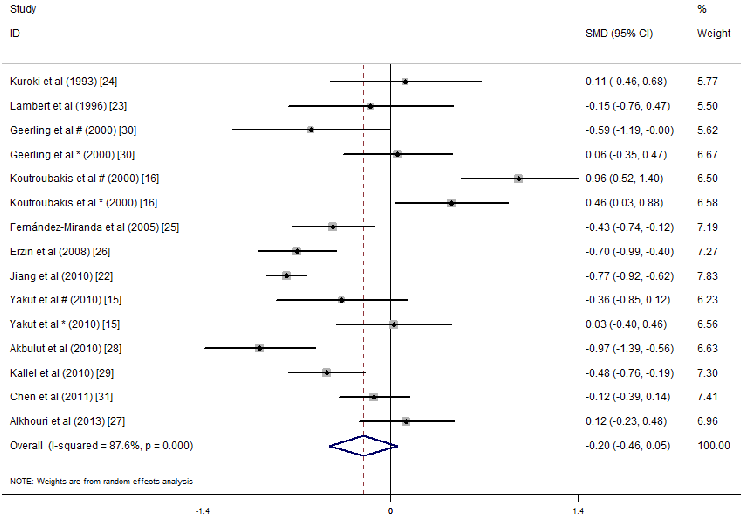
Figure 9
Funnel plot or additional sensitivity analysis evaluating publication bias in the meta-analysis of folate and vitamin B12 levels in inflammatory bowel disease.
forest_plot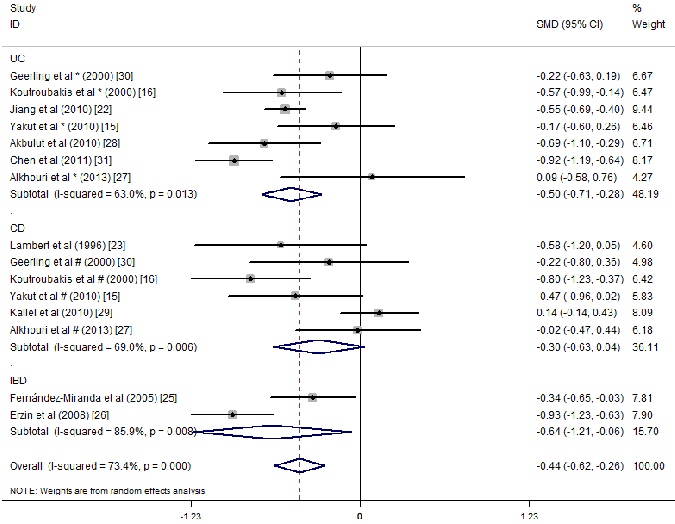
Figure 10
Subgroup analysis stratifying the folate or B12 meta-analysis results by Crohn's disease versus ulcerative colitis, revealing potential differences in micronutrient depletion between IBD subtypes.
forest_plotFigure 12
Forest PlotSource Paper
Associations between Folate and Vitamin B12 Levels and Inflammatory Bowel Disease: A Meta-Analysis.Cite This Figure
 > Source: Yun Pan et al. "Associations between Folate and Vitamin B12 Levels and Inflammatory Bowel Diseas." *Nutrients*, 2017. PMID: [28406440](https://pubmed.ncbi.nlm.nih.gov/28406440/)
<figure>
  <img src="https://pdfs.citedhealth.com/figures/28406440/155.png" alt="Forest plot of serum folate concentrations in IBD patients versus controls, presenting standardized mean differences with 95% confidence intervals. Subtotals are stratified by IBD subtype to examine disease-specific patterns." />
  <figcaption>Figure 12. Forest plot of serum folate concentrations in IBD patients versus controls, presenting standardized mean differences with 95% confidence intervals. Subtotals are stratified by IBD subtype to examine disease-specific patterns.<br>  Source: Yun Pan et al. "Associations between Folate and Vitamin B12 Levels and Inflammatory Bowel Diseas." <em>Nutrients</em>, 2017. PMID: <a href="https://pubmed.ncbi.nlm.nih.gov/28406440/">28406440</a></figcaption>
</figure>